Debugging Explained for Arduino
What is Debugging?
Everybody who writes software with more than a few lines, knows that it won't
initially work as expected.
Debugging is the task of finding bugs in your software.
A debugger is a tool that helps a programmer in finding bugs.
Debugging Without a Debugger
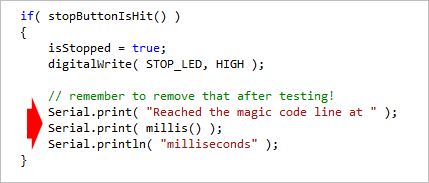
Without a debugger, you probably write test code that sends text to your PC:
To stop a running sketch at a certain location, you probably use this:

or this:
or this:

Writing such test code has the following drawbacks:
- It is time consuming.
- It uses precious program and data memory on your board.
- There is a high risk that you forget some places where you put test code
and it will still be there in your final program version.
- Stopping a sketch might be easy, but try to continue it with the above methods!
Debugging support with the Visual Micro Debugger
With most boards, the Visual Micro debugger uses Hardware Serial or
Software Serial to operate. For newer 32 bit boards, such as the Arduino Zero, a
GDB based option is also available (but only recommended for experts and in some cases
is a less useful, more difficult solution).
Learn more about Extended
GDB debugging.
The key element of all debugging is
breakpoints.
With the Visual Micro debugger, you simply set and clear a breakpoint
at the desired location by pressing [F9]:
![Breakpoint set with [F9]](https://www.visualmicro.com/documentation/pics/Breakpoint-Set-F9.png)
You can have as many breakpoints as you like in your program.
Assuming you have set breakpoints at three locations in your sketch:
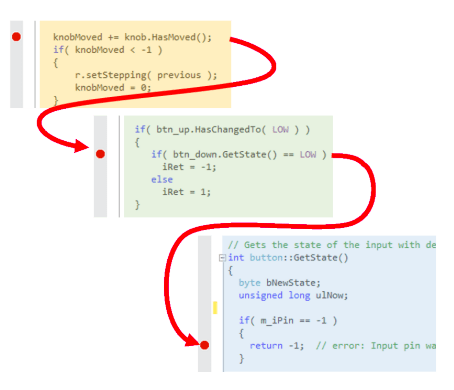
Then you can watch your sketch passing the breakpoints in Visual Micro's Debug
Window, including source file name and line, and a time stamp:

Start and Continue Your Sketch
You can choose if your sketch shall stop as it hits a breakpoint or if it shall
continue to run (which is then called a tracepoint).
When using breakpoints (that keep the sketch halted), then you can measure signals
on your hardware calmly, change anything on your hardware etc.
By pressing  you can continue the execution
of your sketch after it was halted in a breakpoint.
you can continue the execution
of your sketch after it was halted in a breakpoint.
Viewing and changing variables
Knowing a variable's current value, can be essential for understanding your sketch's
inner working.
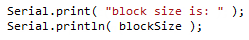
The "classic method" of inserting Serial.print() calls is cumbersome. It's not enough
to print a variable, you also need to add some descriptive text, so that you can
tell all these numbers apart as they appear on your screen, that's why the typical
test code looks like this:
With Visual Micro's debugger, you simply set a breakpoint, as shown
above, and add a message string in the breakpoint's property window:
Visual Studio 2017 and 2019:
Visual Studio < 2017, 2019
and Atmel Studio:
While your sketch runs, you can watch how your variable's value changes in Visual
Micro's Expression Window:
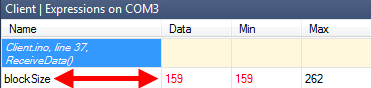
You will also see the min and max value your variable had.
Changing a variable's value
With Visual Micro, you can not only view variable values, you can also change
them.
Whenever your Arduino sketch is halted in a breakpoint, you can change the variable's
value shown in the Expression Window.
Additional Debugging Functionality
This is a list of additional functions Visual Micro offers for your Arduino debugging:
- Conditional breakpoints that only stop your sketch if a
condition is met, e.g. a variable has a certain value
- Breakpoints with counters that stop your sketch only after
a number of passes
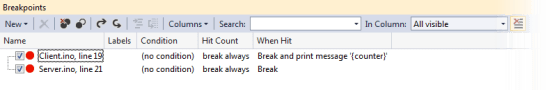
- Enabling/Disabling breakpoints: You can activate or deactivate
breakpoints with a click of your mouse, without building or uploading your sketch.
The Breakpoint Window gives you an overview over all your breakpoints:
- Analog and Digital reporting windows: These windows show
you the state of all analog and/or digital pins of your board.
The Visual Micro Debugger is available during a
30 days
trial period after installation.
After the trial period, you can buy it for a low price.
Read more
This was a brief overview of the debugging capabilities of Visual Micro. Read
the pages mentioned below to learn how to use them with your sketch: