VS Arduino
Visual Micro >> Usb/Serial/WiFi Debugging >> Breakpoints hitting in main sketch, but not in user library
https://www.visualmicro.com/forums/YaBB.pl?num=1541707284

Message started by gj on Nov 8th, 2018 at 8:01pm

Title: Breakpoints hitting in main sketch, but not in user library
Post by gj on Nov 8th, 2018 at 8:01pm
Hello,

As the title says my breakpoints are hitting in the main sketch, but not in the (user)library (cpp).
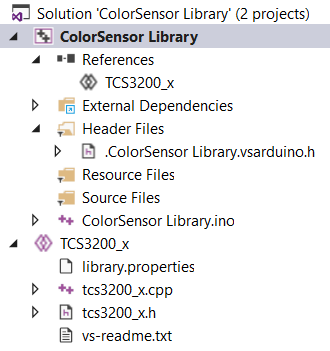
I have added a reference to the library and it's showing in the Solution Explorer
The sketch compiles without errors and runs like it should. The sketch uses routines from the library.
The library contains a class definition.
I've set breakpoints in some of the class-routines, but they're not activated.
The class-library files are NOT in the same directory as the main sketch
The library is in a shared directory to be used by multiple people, so it cannot be created using the "Add code"-feature.


I read in the release notes that since april 2017 (version 1704.30) it is supported to debug cpp-files if they're outside the ino-directory?

I have a fresh install (2 days ago) of Visual Studio 2017 community.
I have a REGISTERED license status


Title: Re: Breakpoints hitting in main sketch, but not in user library
Post by Visual Micro on Nov 9th, 2018 at 1:06pm
Hi,

The REGISTERED status does not affect what features are active

The "Add Code" feature does not have any relation to anything other than be a quick way to add code into a normal arduino project for novice users. In all cases using the standard "Add" features work.

The location of a class lib has no effect on anything.

Can you confirm that the library is a shared library project. That it exists in the solution explorer along with the main arduino project. That the main arduino project has a "shared reference" to the lib project? You might have said this but I want to be clear about what needs to be tested.

Title: Re: Breakpoints hitting in main sketch, but not in user library
Post by gj on Nov 9th, 2018 at 8:27pm
Does the attached screenshot give the confirmation you need?

So, breakpoints DO work in the INO but not in the CPP.

Reference.png ( 14 KB | 3 Downloads )

Title: Re: Breakpoints hitting in main sketch, but not in user library
Post by Visual Micro on Nov 10th, 2018 at 12:18pm
Yes thanks I will have a look over the next few days.


Title: Re: Breakpoints hitting in main sketch, but not in user library
Post by gj on Nov 11th, 2018 at 11:07am
I checked the code in the output-directory.
I found the file tcs3200_x.cpp and it contains this code:


Code (c++):
for (unsigned int i = 0; i < _samples; i++) {
  Serial.print(F("val:")); Serial.println(val);
  val = val + (pulseIn(_out, HIGH) / _samples);
  MicroDebug.OnBreakPointBegin(500);
  if (MicroDebug.outPacketStart(false)) {
    MicroDebug.OnBreakPointPrintBegin(1);
    MicroDebug.transport->print("|");
    MicroDebug.transport->print(val);
    MicroDebug.OnBreakPointPrintEnd();
    MicroDebug.outPacketEnd();
  }
  MicroDebug.DBG_YieldAndWait(5);
  MicroDebug.OnBreakPointEnd();
}


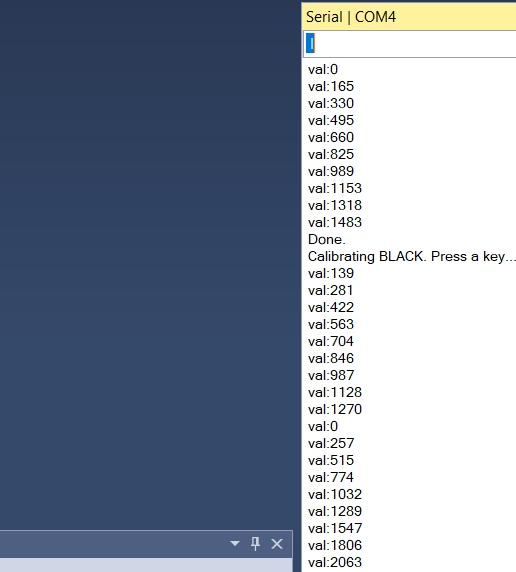
In the Serial monitor I see the Serial-prints coming through so I'm certain this piece of software is run, but appararently the breakpoint is not activated.
Code_with_Breakpoint.png ( 12 KB | 0 Downloads )
Monitor_Expressions_001.png ( 10 KB | 3 Downloads )

Title: Re: Breakpoints hitting in main sketch, but not in user library
Post by Visual Micro on Nov 11th, 2018 at 12:13pm
Thanks

Please open another vs ide instance but do NOT open a project. Then open the serial monitor on the port and let's see what we are actually getting.


Title: Re: Breakpoints hitting in main sketch, but not in user library
Post by gj on Nov 11th, 2018 at 12:24pm
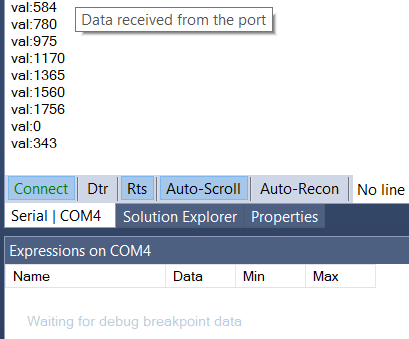
Is this what you want to see?

Opened Vs17 (no project), activated Serial-monitor and connected the Arduino using USB.
After a few seconds the monitor starts showing something (comparable with previous output).
COM4-port.png ( 12 KB | 1 Download )

Title: Re: Breakpoints hitting in main sketch, but not in user library
Post by Visual Micro on Nov 11th, 2018 at 12:39pm
if you also add a breakpoint to the main sketch code do you see that in the serial output of the clean ide instance.

In a clean ide instance you will clearly see the raw visual micro debugger serial output when it exists

+ please move you serial print to after val has been got

Title: Re: Breakpoints hitting in main sketch, but not in user library
Post by gj on Nov 11th, 2018 at 1:54pm
As requested, I moved the Serial.print after the val-calculation.

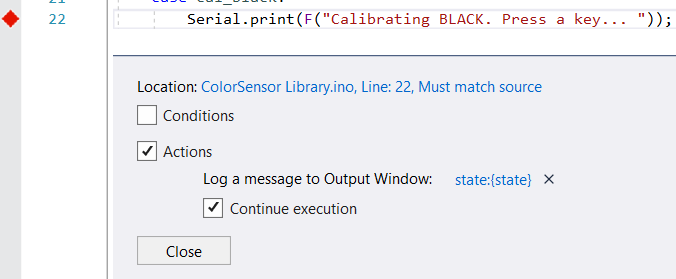
I put a break in the main sketch. See attachments. And they show up nicely in the expression window.
Generated code for this:

Code (c++):
Serial.print(F("Calibrating BLACK. Press a key... "));
MicroDebug.OnBreakPointBegin(500);
if (MicroDebug.outPacketStart(false)) {
  MicroDebug.OnBreakPointPrintBegin(2);
  MicroDebug.transport->print("|");
  MicroDebug.transport->print(state);
  MicroDebug.OnBreakPointPrintEnd();
  MicroDebug.outPacketEnd();
}
MicroDebug.DBG_YieldAndWait(5);MicroDebug.OnBreakPointEnd();
waitForKey();


At this point the monitor-windows (in a clean IDE) shows this: [code]Calibrating BLACK. Press a key... VMDPE_2:2:60826:0:7565|0_VMDPE[/code]

So, it DOES hit at the main sketch but not the library, and does know the right value '0'.
state_expression.png ( 3 KB | 0 Downloads )
state_break.png ( 10 KB | 2 Downloads )

Title: Re: Breakpoints hitting in main sketch, but not in user library
Post by gj on Nov 15th, 2018 at 7:49pm
In the meanwhile I created a new project and copy pasted the code from old to the new.
With no effect unfortunately  :(.

Any news from your end?@ Visual Micro


Title: Re: Breakpoints hitting in main sketch, but not in user library
Post by Visual Micro on Nov 15th, 2018 at 7:52pm
Sorry for the delay I have been tied up with life. I will do some experimenting over the next week or two.

Is the code you have shown below in a method called from the .ino code. IE, not in some c++ static class initialization that happens before the setup() in the .ino code runs?

Title: Re: Breakpoints hitting in main sketch, but not in user library
Post by Visual Micro on Nov 15th, 2018 at 7:55pm
Another point is that the following suggests that your print statement is not adding \r\n after Press a key... or the \r\n is being lost.

Try a delay(1) after the "Press a key...\r\n" message.

If you see this then the debugger will not know about the break point. This is breakpoint #2

Visual Micro needs the VMDPE_ to start on a new line which can then be treated as a debugger packet. This is why your own serial must be terminated by a \r\n prior to a breakpoint being hit.

[code]Calibrating BLACK. Press a key... VMDPE_2:2:60826:0:7565|0_VMDPE[/code]

This issue would be avoided if you use the software serial option OR use alternative serial ports where available. This would allow the debugger to unaffected by your own serial making it less important you ensure \r\n and doubles the outbound serial buffer on your hardware.

Title: Re: Breakpoints hitting in main sketch, but not in user library
Post by gj on Nov 15th, 2018 at 8:03pm
No problem. Having a life is important. Hope you are fine.

This is the fist part of the ino:

Code (c++):

#include <tcs3200_x.h>
typedef enum State { cal_black, cal_white, sampling };

unsigned long val;
State state;

tcs3200_x sensor(3, 4, 5, 6, 7, 8);

void setup()
{
     Serial.begin(115200);
     sensor.setFrequency(TCS_FREQ_20);

     state = cal_black;
     Serial.println(F("Setup finished."));
}

void loop()
{
     int dummy = 0;

     switch (state) {


I have a working(!) breakpoint at the line "int dummy = 0;"
The library-routine that is NOT hitting the breakpoint is called from loop() a few lines after this dummy-line.

The problematic routine is in tcs_3200_x.cpp (snippets shown earlier).
I know the right(?) code is generated in the output directory (that is the MicroDebug-stuff) and I know the routine is being run because I do get the Serial-print-output in that same routine.

Title: Re: Breakpoints hitting in main sketch, but not in user library
Post by gj on Nov 15th, 2018 at 8:17pm
I deliberately used a print in stead of println, because after calibration (that usually produces no output) it shows a "Done".

See snippet.

Code (c++):

           Serial.println(F("Calibrating BLACK. Press a key... "));
           delay(1);
           waitForKey();
           sensor.setCalibration(calibrateBlack);   <-- this is where the problematic routine is called
               Serial.println(F("Done."));
           state = cal_white;
           break;


Unfortunately, even with the additional \r\n (using println in stead of print) and the delay(1) there is still no putpuin the Expression window (except for the breakpoint from the main sketch).

Title: Re: Breakpoints hitting in main sketch, but not in user library
Post by Visual Micro on Nov 15th, 2018 at 8:23pm
I see, ignore the discussion about please wait.. it sounds like the breakpoint serial is not being sent.

But for clarity you should have put the delay after sensor.setCalibration(calibrateBlack); before your println("Done").

Which board do you have?


Title: Re: Breakpoints hitting in main sketch, but not in user library
Post by gj on Nov 15th, 2018 at 8:40pm
Arduino Uno.
Moving the delay(1) right before printing "Done" doesn't solve the issue.

Title: Re: Breakpoints hitting in main sketch, but not in user library
Post by Visual Micro on Nov 15th, 2018 at 10:52pm
Can you confirm the auto generated visual micro code you have posted earlier relates to the breakpoint that is not working? (Code from the .cpp file in the temp build folder)

Title: Re: Breakpoints hitting in main sketch, but not in user library
Post by gj on Nov 17th, 2018 at 10:45am
Yes, I can confirm that.

This code is in de temp Debug-folder in the file tcs3200_x.cpp:

Code (c++):
for (unsigned int i = 0; i < _samples; i++) {
val = val + (pulseIn(_out, HIGH) / _samples);MicroDebug.OnBreakPointBegin(500);if (MicroDebug.outPacketStart(false)) {MicroDebug.OnBreakPointPrintBegin(2);MicroDebug.transport->print("|");MicroDebug.transport->print(val);MicroDebug.OnBreakPointPrintEnd();MicroDebug.outPacketEnd();}MicroDebug.DBG_YieldAndWait(5);MicroDebug.OnBreakPointEnd();
}


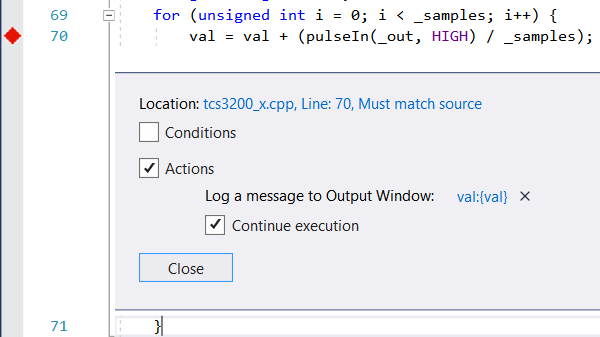
See also the attached screenshot for my own code and the breakpoint.
snippet.png ( 11 KB | 3 Downloads )

Title: Re: Breakpoints hitting in main sketch, but not in user library
Post by Visual Micro on Nov 17th, 2018 at 4:15pm
Thanks, you can ignore all the tests with delay() etc. I found the problem.

The build folder has the correct .cpp code but the compiler was still using the original library source code.

Some users rely on a relative includes to folders (above/outside of) the library folder) which is not good practice in arduino terms. Therefore, a previous fix for that breaks the ability to compile a copy of the library source in a totally different location.

The workaround is a new vMicro>Debugger menu item that enables users to optionally debug in libraries. When the "allow library debugging" is enabled the cloned library sources with debug statements are compiled instead of the original. This also temporarily alters any compiler -I includes paths for the libraries.

An interim release should be published in the next few days.

Thanks for the report.
arduino-library-debugging_002.png ( 96 KB | 1 Download )

Title: Re: Breakpoints hitting in main sketch, but not in user library
Post by gj on Nov 17th, 2018 at 8:02pm
OK. Great that you found the issue.
I'm assuming the screenshot you're showing is one of an upcoming release, since I don't have that option below the vMicro menu?

Title: Re: Breakpoints hitting in main sketch, but not in user library
Post by Visual Micro on Nov 17th, 2018 at 8:21pm
The interim release was going to be a few days and yes that is an image for the new feature in the next release

You can download from the most recent post titled "work in progress" from here Visual Micro Interim Releases and Notifications

Title: Re: Breakpoints hitting in main sketch, but not in user library
Post by gj on Nov 17th, 2018 at 8:49pm
Yes! That did the trick.

I downloaded the work-in-progress-version 1811.17 and installed it.
Triggers are now also fired in the library.  :)

Thanks for your great support!

Title: Re: Breakpoints hitting in main sketch, but not in user library
Post by Visual Micro on Nov 17th, 2018 at 9:27pm
Thanks, I'm not sure the  shared library projects are working entirely right. There might be another release. If it builds for you that is fine.

VS Arduino » Powered by YaBB 2.6.12!
YaBB Forum Software © 2000-2024. All Rights Reserved.