VS Arduino
Visual Micro >> Usb/Serial/WiFi Debugging >> Debugging with jtagice & DebugWire?
https://www.visualmicro.com/forums/YaBB.pl?num=1543419707

Message started by Nebulous on Nov 28th, 2018 at 3:41pm

Title: Debugging with jtagice & DebugWire?
Post by Nebulous on Nov 28th, 2018 at 3:41pm
Hi,
I am trying to use Visual Micro for debugging, but am not having any luck.

I have Atmel Studio 7 + "Arduino IDE for Atmel Studio 7" V 1811.24.0 installed.

I want to use my jtagice mk2 in DebugWire mode to debug an arduino .ino project (blinky example) on a custom board with a ATMega328PB.

I have a know good hardware setup and can debug native Atmel Studio project without a problem.

Is this supported?
There doesn't seem to be an option for it in vMicro - Uploader - Programmer:
The closest is "Atmel Studio JTAG ICE MK2 (ISP)"

I have already fused my target micro for DebugWire (thus disabling ISP) so I wasn't surprised it didn't download, but don't know how to proceed.

Any help would be appreciated.

If I try to debug, the message window shows this:


Code (]Uploading 'Sketch1' to 'Atmel atmega328pb Xplained mini' using 'Atmel Studio JTAG ICE MK2 (ISP)'
[ERROR):

An unexpected error occurred when executing.
Traceback (most recent call last):
  File "atmel\atprogram.py", line 48, in run
Error during upload using programmer
The uploader process failed

The uploader process failed
  File "atmel\avr\cli\commandline.py", line 54, in execute_commands
The uploader returned an error
  File "atmel\avr\cli\commandexecutor.py", line 52, in execute_commands
  File "atmel\avr\cli\resourcemanager.py", line 44, in prepare_resources
  File "atmel\avr\cli\resourcemanager.py", line 51, in _prepare_resource
  File "atmel\avr\cli\resourcecontainers.py", line 54, in allocate
  File "atmel\avr\cli\backend.py", line 134, in start
  File "subprocess.py", line 702, in __init__
  File "subprocess.py", line 823, in _get_handles
WindowsError: [Error 6] The handle is invalid

Title: Re: Debugging with jtagice & DebugWire?
Post by Visual Micro on Nov 28th, 2018 at 8:07pm
Visual Micro is a serial debugger.

In Atmel studio use the "Atmel device programming" programmer. This then hands over to standard atmel studio device programming for the project. (see atmel user guide)

If you want to debug using atmel debug then you need to follow the instructions on the visual micro atmel studio 7 page or use the atmel project converter.

If you want to use device programming or programmer for upload and then use the visual micro serial debugger then set the local and remote port on the vMicro>Debugger menu

Title: Re: Debugging with jtagice & DebugWire?
Post by stevewidg on Nov 29th, 2018 at 3:42pm
Hi
I get EXACTLY same error message trying to use an Atmel Ice  using Atmel Studio ICE-ISP  under VM with'always use programmer' selected and Atmel ICE ISP selected under tools.It programs fine using TOOLS>PROGRAM etc.
Any Suggestions
PLease
Steve

Title: Re: Debugging with jtagice & DebugWire?
Post by Nebulous on Nov 29th, 2018 at 5:05pm

Tim@Visual Micro wrote on Nov 28th, 2018 at 8:07pm:
Visual
If you want to debug using atmel debug then you need to follow the instructions on the visual micro atmel studio 7 page or use the atmel project converter.

Do you have any links to those instructions?
I found this page but it doesn't explain anything.


Title: Re: Debugging with jtagice & DebugWire?
Post by Visual Micro on Nov 29th, 2018 at 5:58pm
The visual studio extension link in the page you posted is what you want.

It is also in the links at the top of the visual micro home page

Title: Re: Debugging with jtagice & DebugWire?
Post by Nebulous on Nov 30th, 2018 at 3:11pm
Thanks VM. I have read through that page and I still can't get it to work.
When I try to debug (the green play button), it invokes the "Device programming" dialog as if it is set for ISP. When I do that in a native AS7 project I don't see that and it automatically downloads via DebugWire where I can then run, step etc.

Setup:
  • My project has an empty "Sketch1.ino" file.
  • A "Sketch1.cpp" file containing the arduino blink sketch plus #include <arduino.h> as the first line.
  • In project Properties>Tool I set the programmer to JTAGICE mkII and interface to debugWIRE.
  • vMicro>Uploader>Programmer is set to "Atmel Studio Device Programming" and "Always use programmer for upload" is ticked.
  • vMicro>Debugger>Atmel Studio Debugger is ticked.


Title: Re: Debugging with jtagice & DebugWire?
Post by Visual Micro on Dec 1st, 2018 at 1:00am
If I recall you can "right click > project name > project properties" then set the Tool.

Are you using avr or sam or samd?

Title: Re: Debugging with jtagice & DebugWire?
Post by Nebulous on Dec 1st, 2018 at 10:45am

Tim@Visual Micro wrote on Dec 1st, 2018 at 1:00am:
If I recall you can "right click > project name > project properties" then set the Tool.
Yes, that's what i did.


Tim@Visual Micro wrote on Dec 1st, 2018 at 1:00am:

Are you using avr or sam or samd?
Avr.

The problem I have is that when I hit the "Start Debugging" button, instead of seeing in the bottom left corner of the IDE "Writing %", followed by "Running" like a native project would, the "Device Programming" dialog pops up, from which there is no way to activate debugging.
It is as if the "Start Debugging" button is being overridden by an incorrect command somewhere. Or maybe the vMicro>Debugger>Atmel Studio Debugger selection is being ignored.  :(

Title: Re: Debugging with jtagice & DebugWire?
Post by Visual Micro on Dec 1st, 2018 at 2:46pm
Is "vmicro>debugger>use atmel studio debugging" enabled?

Title: Re: Debugging with jtagice & DebugWire?
Post by Nebulous on Dec 1st, 2018 at 3:32pm
Yes, that is ticked.

edit:
although the word "use" is not there.

Title: Re: Debugging with jtagice & DebugWire?
Post by Visual Micro on Dec 1st, 2018 at 3:37pm
pls zip and attach your .cppproj file

Thanks

Title: Re: Debugging with jtagice & DebugWire?
Post by Nebulous on Dec 1st, 2018 at 3:43pm
zip file attached. Thanks.

https://www.visualmicro.com/forums/YaBB.pl?action=downloadfile;file=Sketch1_002.zip ( 6 KB | 7 Downloads )

Title: Re: Debugging with jtagice & DebugWire?
Post by Visual Micro on Dec 2nd, 2018 at 12:08pm
Sadly, once you are in native atmel mode there is little I can do to help via Visual Micro.

Your project looks okay to me. The ccp proj files are just text/xml you can look in them and change them if required.

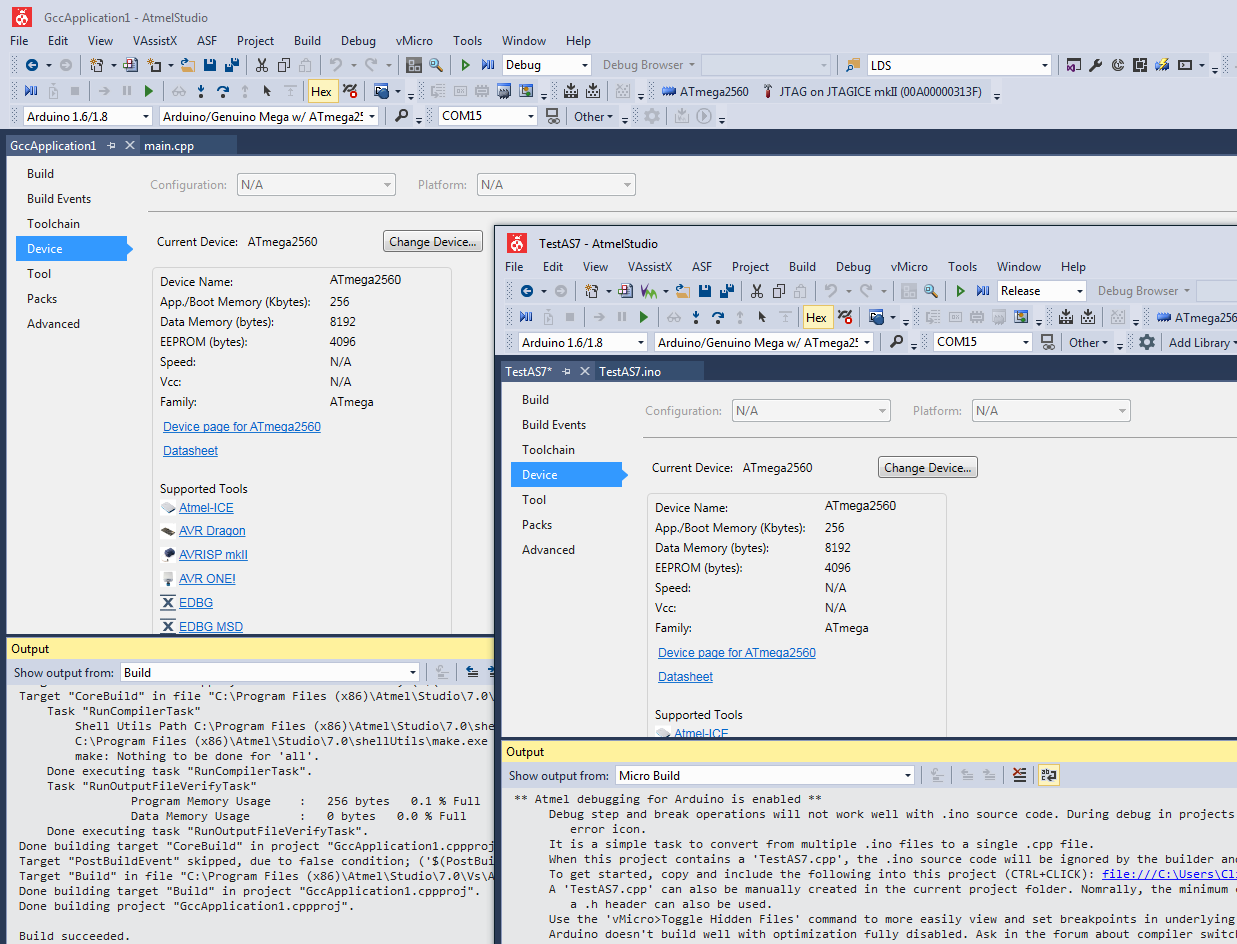
I used "File>New>Arduino Project" to create a Test project and used Atmel to create a GCC executable. Then compared the two projects and they look the same.

What do you see different?


note: You will see that I have used a standard arduino project for comparison. The .ino/cpp file naming configuration is not relevant to this discussion of "tools".


as7-avr8.png ( 99 KB | 2 Downloads )

Title: Re: Debugging with jtagice & DebugWire?
Post by Nebulous on Dec 3rd, 2018 at 1:00pm

Tim@Visual Micro wrote on Dec 2nd, 2018 at 12:08pm:
I used "File>New>Arduino Project" to create a Test project and used Atmel to create a GCC executable. Then compared the two projects and they look the same.

What do you see different?


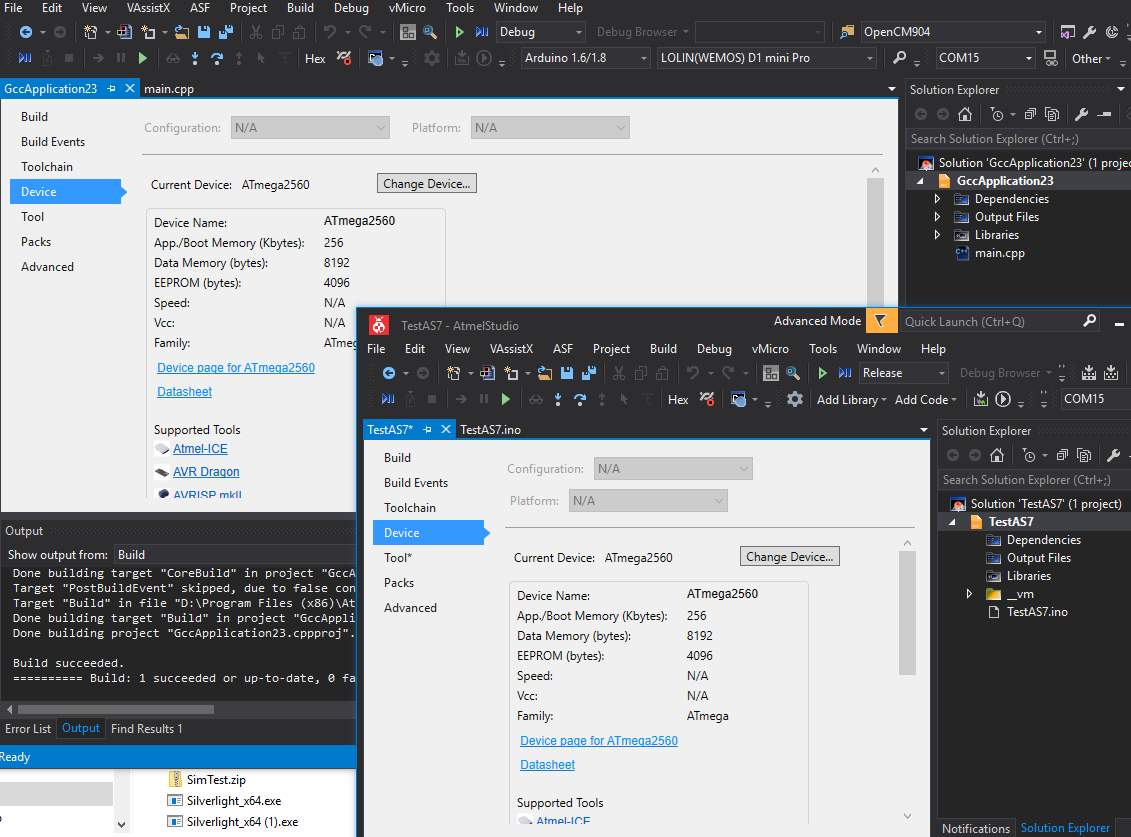
I have done the same and see the same as your screenshots. (or did you mean to compare the .cppproj file?)


as7ScrShot.png ( 138 KB | 2 Downloads )

Title: Re: Debugging with jtagice & DebugWire?
Post by Visual Micro on Dec 3rd, 2018 at 1:09pm
Maybe something has changed in as7, it's can be difficult at times.

We might have to compare the two ccpproj project files to see what might be missing.

The problem is that Visual Micro doesn't have to do anything when you switch to atmel mode. So we just need to ensure the correct project properties are set.

Title: Re: Debugging with jtagice & DebugWire?
Post by Nebulous on Dec 15th, 2018 at 2:50pm
Hi,
I have spent more time on this and although I haven't fully solved my problems I have narrowed it down to an exact sequence of events:

[code] 1. Starting with an Arduino Mega clone that works when I upload Blink sketch to via Arduino IDE and USB port.
2. Soldered a JTAG socket to board onto relevant JTAG pins on the ATMEGA2650 .
3. In VS7 File>New>Project>Arduino Sketch.  Name it VM_Blink. Ok
4. Visual Micro pops up a message about removing main.cpp.  I select Yes.
5. Project is created with a VM_Blink.ino containing an empty setup and loop function.
6. I replace the contents of VM_Blink.ino with the code from the Arduino Blink sketch example.
7. In Project>VM_Blink Properties... I Check I have the correct microprocessor device in "Device".
8. In "Tool" I set the debugger/programmer to JTAGICE mkII and interface to JTAG.
9. I Click Build VM_Blink and it compiles successfully in the output window plus tells me about how debugging doesn't work well with .ino file. I ignore that for the time being.
10. In vMicro I check I have the correct Com Port for the USB port on the Mega.
11. Now I click vMicro>Build & Upload.  Code uploads via the USB and works.
12. So far so good. I now have the equivalent environment as the Arduino IDE.
13. Now to do debugging via JTAG.
14. Select vMicro>Debugger>Atmel Studio Debugger.
15. I DO NOT Select vMicro>Uploader>Always Use Programmer For Upload.
16. Go into Tools>Device Programming and select JTAGICE mkII / ISP then Apply.
17. I connect my JTAG, via an adapter to the 6-pin ISP on the Mega.
18. Read the fuses, then select the JTAGEN fuse and then program the fuses, accepting the warning message. Fuses are now FD 98 FF
19. Now I connect the JTAG to the JTAG socket I added to the Mega board.
20. Click Debug>Start Debugging And Break.
21. Code uploads and runs, but the initial break was somewhere in wiring.h. That's fine, I assume this is due to the reason in the warning in point number 9.
22. I Click Debug->Stop Debugging.
23. Click Debug>Start Debugging And Break for a second time, but it fails to upload.
24. I notice that since the first successful debug run the fuses have changed from FD 98 FF to FD 90 FF. The change is the EESAVE fuse which I don't believe is causing this problem.
25. I reset / repower the hardware but it will no longer enter debugging via JTAG.
26. I go back to Arduino IDE and, using a USBAsp programmer, select Tools>Burn Bootloader
27. I now re-enable the JTAG fuse again as in 18.
28. I can now debug again, but only once as before.[/code]
So does anyone know why I only get one go at debugging, then have to re-burn the bootloader again in Arduino IDE to get it to work again in AS7?

Thanks.

Edit: I forgot to say, since my original post I have switched to using more standard hardware and full JTAG instead of DebugWire in case that was causing a problem.

Title: Re: Debugging with jtagice & DebugWire?
Post by Visual Micro on Dec 15th, 2018 at 2:56pm
What atmel studio is doing is killing the bootloader. You must reverse your thinking of point 15 and have visual micro use the "atmel device programmer" and "always use programmer"


Title: Re: Debugging with jtagice & DebugWire?
Post by Nebulous on Dec 15th, 2018 at 3:45pm
Thanks VM, I selected that and it is working now. :D

The reason I had that turned off is because it calls up the Device Programming dialog, which previously I would click Close and then it failed, which seemed as if it was not the correct way, but now when I click close it works. ?
I don't know it it's related, but since I started this thread I've wiped my old Windows 7 system with years of old versions installed, and did a clean install of Windows 10 with only the latest Versions installed (didn't do that because of this problem, just coincidence).

Any way of not getting it to bring up the Device Programming dialog or is that asking too much  :)

Title: Re: Debugging with jtagice & DebugWire?
Post by Nebulous on Dec 20th, 2018 at 2:58pm
Thanks very much for all your help. I now have it working perfectly with my custom board and atmega328pb device. :D
I went ahead a purchased a licensed copy.

Title: Re: Debugging with jtagice & DebugWire?
Post by Visual Micro on Dec 20th, 2018 at 7:44pm
Thank you

VS Arduino » Powered by YaBB 2.6.12!
YaBB Forum Software © 2000-2024. All Rights Reserved.