Post by ccdman on Jul 19th, 2019 at 3:24am
Hello,
I am using the paid version of VS Micro Pro with VS2017. Both have been updated to the current level. I set up GDB as per the instructions in https://www.visualmicro.com/page/ESP8266-Debugging.aspx.
The hardware is a NodeMCU 1.0 ESP8266.
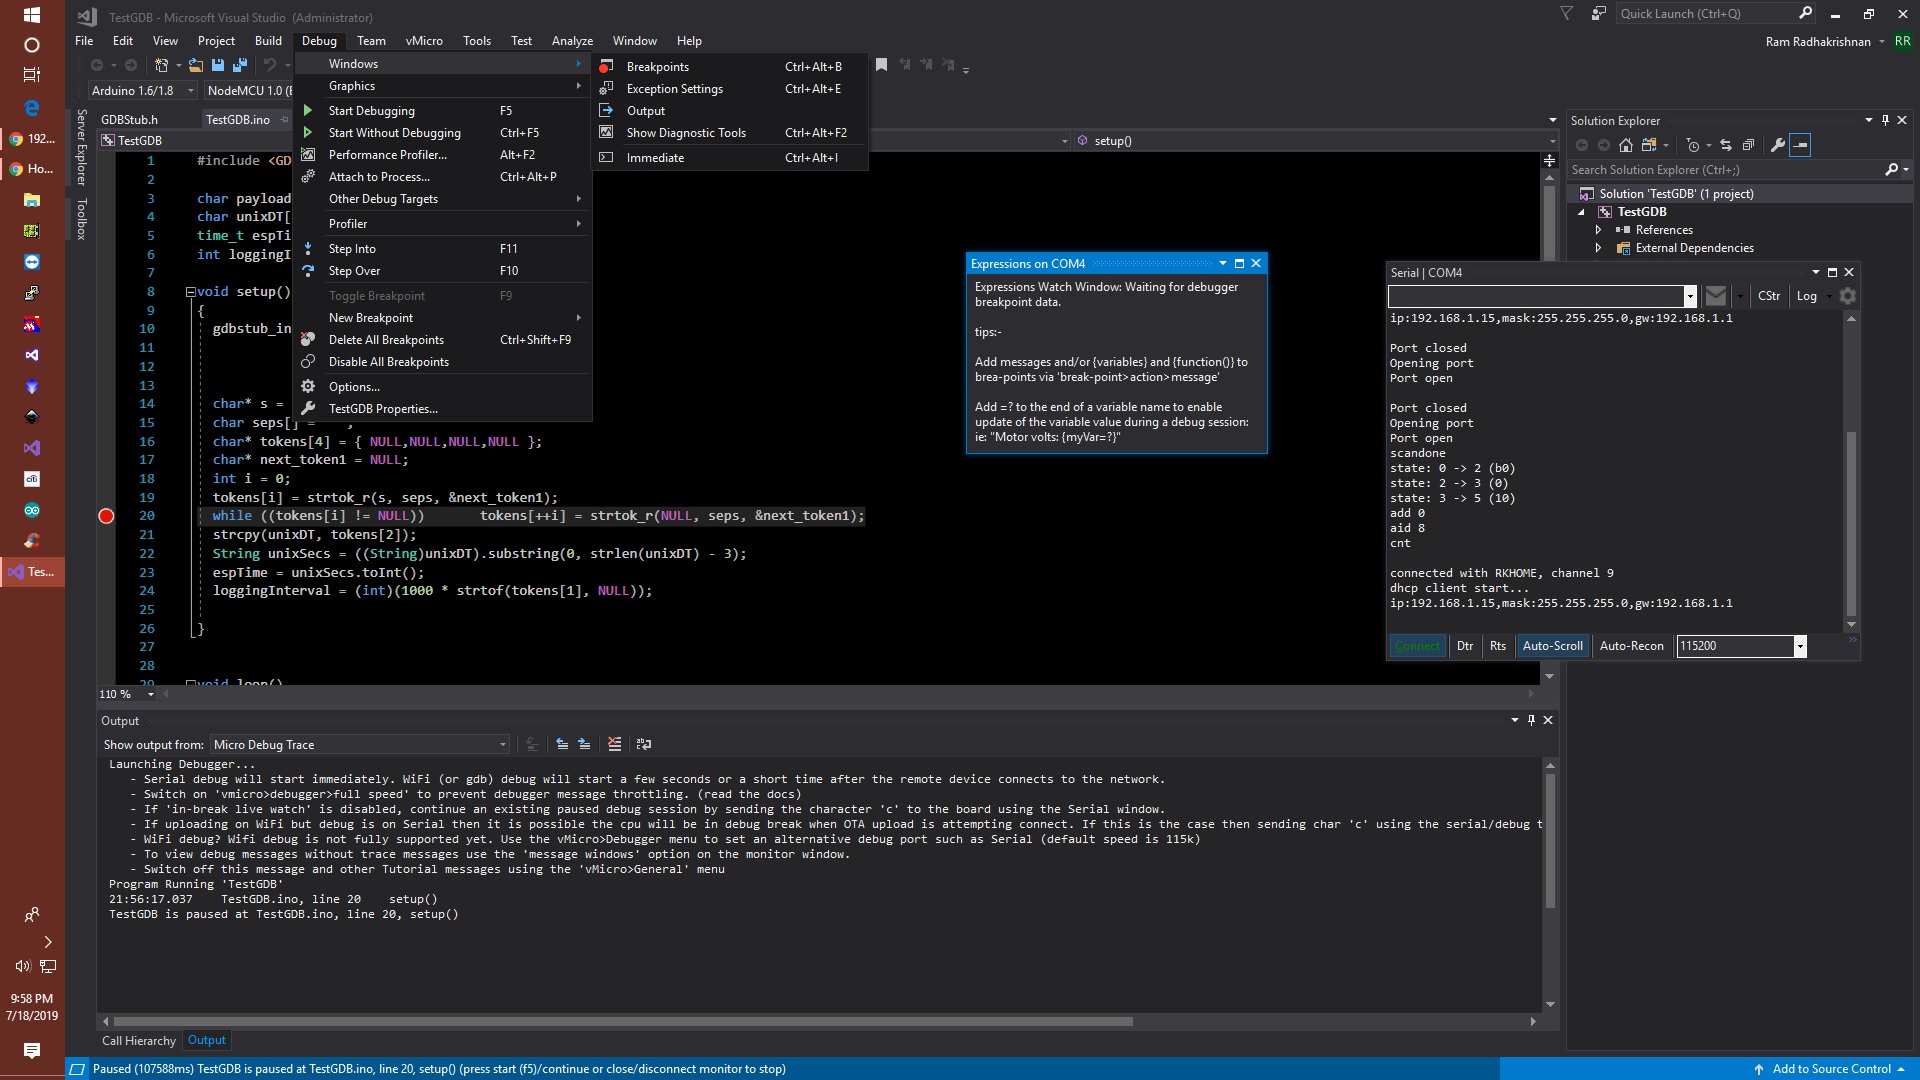
When I reach for the familiar Debug | Windows drop down, I expected to see disassembly, watch, locals and other windows, but the only ones are:Breakpoints, Exception Settings,Output, Show Diagnostic Tools, and Immediate.
I have made a thorough search of all the forum posts and the web in general and have not been able to find an answer. Maybe Tim can pitch in and tell me what I am doing wrong ? Here is a screenshot:
 GDB_screenshot.jpg ( 432 KB | 7
Downloads )
I am using the paid version of VS Micro Pro with VS2017. Both have been updated to the current level. I set up GDB as per the instructions in https://www.visualmicro.com/page/ESP8266-Debugging.aspx.
The hardware is a NodeMCU 1.0 ESP8266.
When I reach for the familiar Debug | Windows drop down, I expected to see disassembly, watch, locals and other windows, but the only ones are:Breakpoints, Exception Settings,Output, Show Diagnostic Tools, and Immediate.
I have made a thorough search of all the forum posts and the web in general and have not been able to find an answer. Maybe Tim can pitch in and tell me what I am doing wrong ? Here is a screenshot:
 GDB_screenshot.jpg ( 432 KB | 7
Downloads )