VS Arduino
Visual Micro >> Hardware Debugging (GDB, GDB WiFi, GDB Stub) >> (ESP32Devkit+ESPPROG) Unable to start debugging. Unable to establish a connection to GDB
https://www.visualmicro.com/forums/YaBB.pl?num=1646252932

Message started by Bizi1234 on Mar 2nd, 2022 at 8:28pm

Title: (ESP32Devkit+ESPPROG) Unable to start debugging. Unable to establish a connection to GDB
Post by Bizi1234 on Mar 2nd, 2022 at 8:28pm
Hi,
I am working with Visual Micro. Actually the hardware debugging fails with a ESP32 Dev-kit and a ESP32-PROG. The upload works via the ESP32-PROG device.
Do you have any ideas for this problem.

Thanks in advance, Andreas


Title: Re: Unable to start debugging. Unable to establish a connection to GDB
Post by Simon@Visual Micro on Mar 4th, 2022 at 3:50pm
Thanks for the report.

Can you confirm which ESP32 chip is on your ESP-Devkit Board? (it will be on the silver cover on the ESP32 chip itself, normally ESP32-WROOM / ESP-WROVER / ESP-WROVER-E)

Also please attach the OpenOCD Log from the build folder, which can be found as shown in the below link:
https://www.visualmicro.com/page/Troubleshooter-for-Debugging-an-Arduino-Sketch-in-vMicro.aspx#cantFindOpenOCDLogFile

Title: Re: Unable to start debugging. Unable to establish a connection to GDB
Post by Bizi1234 on Mar 6th, 2022 at 9:46am
thanks for your help

It is a ESP32-WROOM device

greetings, Andreas
https://www.visualmicro.com/forums/YaBB.pl?action=downloadfile;file=vMicro_TEST_ino_DebugOpenOCD.zip ( 0 KB | 1 Download )
Title: Re: Unable to start debugging. Unable to establish a connection to GDB
Post by Simon@Visual Micro on Mar 7th, 2022 at 5:13pm
Thanks for the log file information, it doesn't show any issues talking to the ESP-PROG or the ESP-Devkit target either (it looks like it has halted both cores).

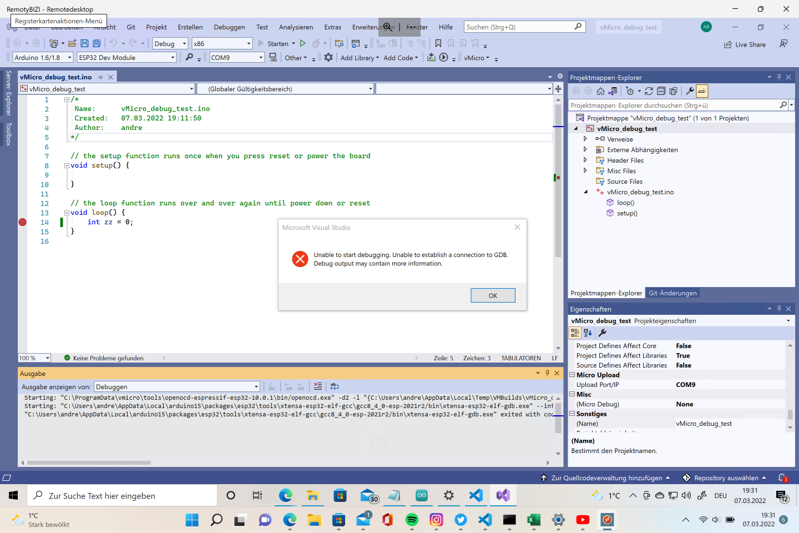
Do you see any error messages when trying to start the debugging in Visual Studio? (if yes please send a screenshot)

Could you also attach the full build output, with the below options enabled:
vMicro > Compiler > Verbose
vMicro > Compiler > Show Build Properties
vMicro > Uploader > Verbose

Title: Re: Unable to start debugging. Unable to establish a connection to GDB
Post by Bizi1234 on Mar 7th, 2022 at 6:38pm
..thanks for your effort  :)

Andreas
https://www.visualmicro.com/forums/YaBB.pl?action=downloadfile;file=vMicro_debug_test.zip ( 3440 KB | 2 Downloads )
error_screen.png ( 244 KB | 2 Downloads )

Title: Re: Unable to start debugging. Unable to establish a connection to GDB
Post by Simon@Visual Micro on Mar 7th, 2022 at 7:06pm
Thanks for the information.

If you downgrade the ESP32 core to version 2.0.0, this should then work as expected.

There is an issue with versions 2.0.1 and 2.0.2 which has been reported on the below page:
https://github.com/espressif/arduino-esp32/issues/6128

Title: Re: Unable to start debugging. Unable to establish a connection to GDB
Post by Bizi1234 on Mar 7th, 2022 at 8:52pm
thanks, I have downgraded to ESP32 core 2.0.0.
Now it seems that the debugger is working.

I have one more question:
In my example code I have set a breakpoint at bb=45, but it seems, that the debugger is not stopping (the red breakpoint circle has no yellow fringe)

example code:
/*
Name:            vMicro_debug_test.ino
Created:      07.03.2022 19:11:50
Author:      andre
*/

// the setup function runs once when you press reset or power the board
void setup() {
     int bb = 0;
     bb = 45;
}

// the loop function runs over and over again until power down or reset
void loop() {
     int zz = 0;
}

Title: Re: Unable to start debugging. Unable to establish a connection to GDB
Post by Simon@Visual Micro on Mar 8th, 2022 at 11:14am
Thanks for the update.

If you use the Debug > Start Debugging, this will upload the code again and attach the debugger automatically.

If this doesn't land on the break, it may be that the debugger is launching too soon.  To resolve this, you can add a local board.txt to the project (vMicro > Add Code > Add Local Board.txt), and add the below line to it:
[code]# Add a delay after upload before the debugger kicks in by using a ping to ourselves as a delay (Windows has no native "sleep")
recipe.hooks.deploy.postupload.1.pattern=cmd.exe /c ping localhost -n 10 [/code]

Then try running Debug > Start Debugging again.

Title: Re: Unable to start debugging. Unable to establish a connection to GDB
Post by Bizi1234 on Mar 8th, 2022 at 8:19pm
..thanks for your answer, but the debugger is still not stopping on the breakpoint.

Do you have another idea?

Greetings Andreas

Title: Re: Unable to start debugging. Unable to establish a connection to GDB
Post by Simon@Visual Micro on Mar 9th, 2022 at 10:05am
Can you confirm you are using Debug > Start Debugging to begin the debug session, with the break point already set?

Can you also confirm the optimization setting on the vMicro > Debugger > Compiler Optimization?

Does adding a 3 second delay to the top of setup improve the situation?


Title: Re: Unable to start debugging. Unable to establish a connection to GDB
Post by Mark T on May 5th, 2022 at 1:54am
I have found from much trial and error that if I run and start debugging with the esp32 only connected to the esp-prog and the esp32 *disconnected* from the usb input that it will start most of the time and stop at any set breakpoint. After the esp32 starts downloading only then reconnect the esp32 to the usb input to get the serial up. Once it runs one time as described above, I can then permanently leave the usb connected to the to the esp32 module and do a faster upload through the serial port.

Also to note that I randomly see the usb driver for the debugger revert back to the windows default and loose contact with the debugger. I often have to reuse the zadig utility to restore the configuration. When debugging I keep the windows device manager running and check that there is only one com port listed for the debugger and that there is an additionally entry under usb devices for the debugger.

Happy debugging!

Title: Re: Unable to start debugging. Unable to establish a connection to GDB
Post by Simon@Visual Micro on Jan 19th, 2023 at 9:41am
Off-Topic replies have been moved to this Topic.

Title: Re: Unable to start debugging. Unable to establish a connection to GDB
Post by PavlosA on Jan 18th, 2023 at 11:34pm

Bizi1234 wrote on Mar 8th, 2022 at 8:19pm:
..thanks for your answer, but the debugger is still not stopping on the breakpoint.

Do you have another idea?

Greetings Andreas


Andreas,

Try changing these two lines:

  int bb = 0;
     bb = 45;

To:  "volatile int bb = 0;  bb = bb + 1;"

Then put the breakpoint on bb = bb + 1;

Good luck.

VS Arduino » Powered by YaBB 2.6.12!
YaBB Forum Software © 2000-2024. All Rights Reserved.