Post by JoHa on Jun 6th, 2022 at 4:07am
Having a problem debugging my code on my ESP32 C3 01M using vMicro and ESP Prog with Visual Studio 2019.
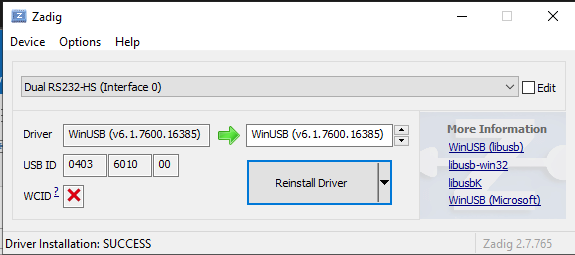
I updated the usb driver "Dual RS232-HS (Interface 0) using Zadig 2.7.765.
I would like your help to understand and solve the issue.
Here the full Micro Build output window:
esptool.py v3.1
Merged 2 ELF sections
Program size: 170,716 bytes (used 13% of a 1,310,720 byte maximum) (5.90 secs)
Minimum Memory Usage: 9168 bytes (3% of a 327680 byte maximum)
Uploading 'DebuggerPrj' to 'ESP32C3 Dev Module' using 'ESP32 PROG'
Open On-Chip Debugger v0.10.0-esp32-20190313 (2019-03-13-09:57)
Licensed under GNU GPL v2
For bug reports, read
http://openocd.org/doc/doxygen/bugs.html
debug_level: 0
adapter speed: 2000 kHz
esp32 interrupt mask on
****[vMicro]**** Uploading App :Error: libusb_open() failed with LIBUSB_ERROR_NOT_SUPPORTED
Error: JTAG scan chain interrogation failed: all zeroes
Error: Check JTAG interface, timings, target power, etc.
Error: Trying to use configured scan chain anyway...
Error: esp32.cpu0: IR capture error; saw 0x00 not 0x01
Error: JTAG scan chain interrogation failed: all zeroes
Error: Check JTAG interface, timings, target power, etc.
Error: Trying to use configured scan chain anyway...
Error: esp32.cpu0: IR capture error; saw 0x00 not 0x01
Error during upload using programmer
The uploader process failed
The uploader process failed
The uploader returned an error
 Zadig.png ( 23 KB | 0
Downloads )
 vMicro_Config.png ( 9 KB | 0
Downloads )
I updated the usb driver "Dual RS232-HS (Interface 0) using Zadig 2.7.765.
I would like your help to understand and solve the issue.
Here the full Micro Build output window:
esptool.py v3.1
Merged 2 ELF sections
Program size: 170,716 bytes (used 13% of a 1,310,720 byte maximum) (5.90 secs)
Minimum Memory Usage: 9168 bytes (3% of a 327680 byte maximum)
Uploading 'DebuggerPrj' to 'ESP32C3 Dev Module' using 'ESP32 PROG'
Open On-Chip Debugger v0.10.0-esp32-20190313 (2019-03-13-09:57)
Licensed under GNU GPL v2
For bug reports, read
http://openocd.org/doc/doxygen/bugs.html
debug_level: 0
adapter speed: 2000 kHz
esp32 interrupt mask on
****[vMicro]**** Uploading App :Error: libusb_open() failed with LIBUSB_ERROR_NOT_SUPPORTED
Error: JTAG scan chain interrogation failed: all zeroes
Error: Check JTAG interface, timings, target power, etc.
Error: Trying to use configured scan chain anyway...
Error: esp32.cpu0: IR capture error; saw 0x00 not 0x01
Error: JTAG scan chain interrogation failed: all zeroes
Error: Check JTAG interface, timings, target power, etc.
Error: Trying to use configured scan chain anyway...
Error: esp32.cpu0: IR capture error; saw 0x00 not 0x01
Error during upload using programmer
The uploader process failed
The uploader process failed
The uploader returned an error
 Zadig.png ( 23 KB | 0
Downloads )
 vMicro_Config.png ( 9 KB | 0
Downloads )
