The ESP32SS3 Modules are being adopted many boards, all of which can now be debugged using an External Hardware debugger, directly in Visual Studio, with vMicro!
This page applies to all ESP32S3 Modules. See these pages for the ESP32S2, ESP32S3 via USB, ESP32C3 via JTAG and ESP32C3 via USB.
If you are using ESP32 Core v2.0.0 - 2.0.2 there is an issue with the GDB.exe reported here. Update to v2.0.3 onwards which have the issue resolved.
If you are using "Upload via Programmer", ensure you do not use v2.0.4 as this has an issue with bootloaders.
External Debug Interface: USB (Default)
If you are looking to use USB to debug this board please see the seperate page here.
To see a list of all debuggers currently supported within vMicro please click here.
NOTE: If using External JTAG debugging any SDCard functionality will need to be removed as this conflicts with the JTAG pin assignments.
All boards support the vMicro Software Debugger which only requires the Serial interface to work
JTAG External Debugger Connections
You will need to set a Fuse bit to enable JTAG! This operation is irreversible, so be sure you want to do this before burning the fuse.
Check Fuse Bits
Download the full ESPTOOL from GitHub: https://github.com/espressif/esptool/releases/download/v3.3/esptool-v3.3-win64.zip
Extract it to a folder on your PC.
Open a command line and navigate to the esptool folder you created above.
cd %USERPROFILE%\Downloads\esptool-v3.3-win64
Run the script to show the current fuse summary:
espefuse.exe --port COM5 summary
You will see output similar to below:
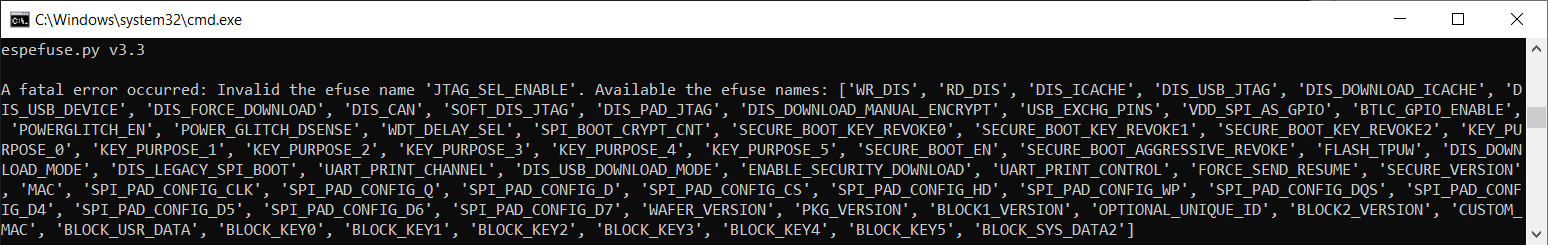
The above output is from a ESP32-C3-DevKitC-02 which does not have the STRAP_JTAG_SEL fuse available.
- The
STRAP_JTAG_SEL needs to be set, which allows GPIO3 to be pulled LOW at boot to enable the JTAG Pins. If not pulled LOW then the USB-JTAG functionality is available.
- If
STRAP_JTAG_SEL is not present, you will need to set the DIS_USB_JTAG Fuse, which PERMANENTLY disables USB debugging on this board, and cannot be undone.
Burning the Fuse
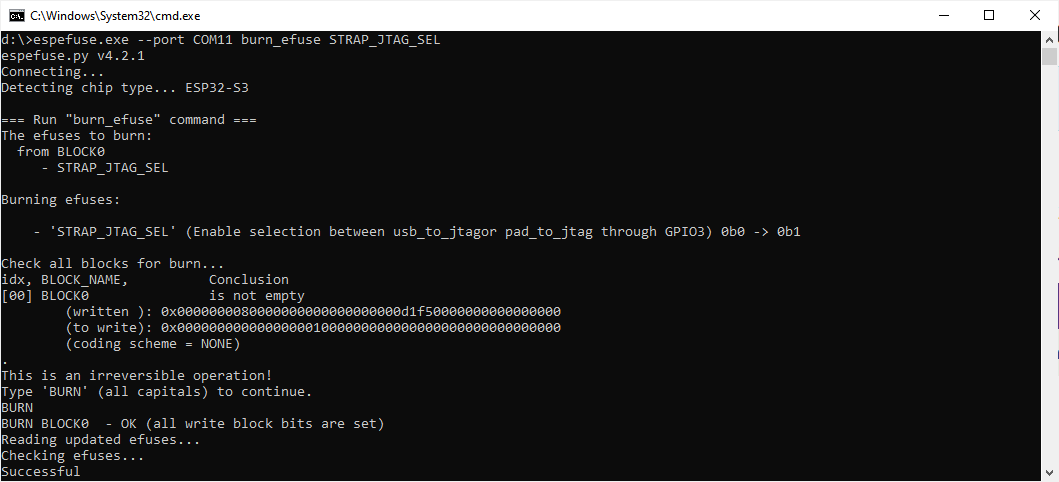
espefuse.exe --port COM5 burn_efuse STRAP_JTAG_SEL
If you do not have the fuse you will see this output:
If you do have the fuse, you may have to type in "BURN" to continue burning the fuse, as shown below:
Once complete run the summary command again:
espefuse.exe --port COM5 summary
Check the STRAP_JTAG_SEL or DIS_USB_JTAG is set to True in the output depending on which fuse you burned.
JTAG Wiring Connections
NOTE: If you have set the JTAG_SEL_ENABLE Fuse above you will also need to connect IO3 to GND when resetting the board.
To connect your JTAG debugger to the ESP32S3 board you will need to connect the below pins:

Specific Probe Wiring Diagrams
ESP-PROG Wiring Diagram
FT2232H Dual
FT2232 Mini Module
TODO: ESP-DEVKIT Wiring Diagram
Then you will also need to connect your Debugger to the PC on one USB port, and the ESP32 on another USB Port
Software Setup
There is also a video guide to the software and driver setup described below
Ensure you have Visual Studio and the vMicro Extension Installed
Open your Sketch and select the Debug > Hardware, and the relevant Debugger you have available

NOTE - The vMicro > Debugger > Compiler Optimization MUST be set to "No Optimization" for this board to function with the debugger
You may need to install an additional USB Driver on Interface 0 of your debugger to allow it to function with this software - check in the debugger list here
Remember - If you have installed a new driver, you may have to do it again if you connect the debugger to a different USB port next time.....
Start Debugger
- Ensure you have the Debug Configuration selected from the Configuration Manager Window
- If you know where you want the first breakpoint in your code, add it now
- To start the debugging process, you can either:
- "Debug > Attach to Process" button if your code has already been uploaded to the ESP32 board
- "Debug > Start Debugging" if your code has not been uploaded
Congratulations - you should have the debugger running, and further windows can be opened from the "Debug > Windows" menu once you have started debugging
See our GDB Debugging in Brief guide, or our detailed GDB Debugging Tutorial for Arduino to learn more about using the debugging interface.
There is also a video guide on this below: