Export Web Debugger (Experimental)

In the latest release of Visual Micro there is now a new Pre-Alpha Feature "Export Web Debugger".

This allows you harness the Serial Monitor, and the Serial Debuggers' Step, Watch, and Chart tools all from a Web Interface instead of directly through Visual Studio.


Click on the Tabs below to read more about the Features, and how to Get Started.


Note Icon Technical Notes

In the current version:-
  • Currently only supports HTTP / WS (not HTTPS or WSS)
  • Supports all Serial Devices and Teensy Devices (UDP Transport coming soon)


Features

Access from Other Devices

As this is available via a Web Page, any device with a Web Browser can display this interface and use the controls.

Note Icon How To:

Ensure your IP is set correctly above, and load on your PC as normal.  Take note of the address loaded in the web browser when the Web Debugger starts, and simply load this on another device on the same network (e.g. Home WiFi).

This will load the same interface on your secondary device.


Debug Session Sharing

Due to how this software works, you can load the same URL on multiple devices, and both see the result of the others changes (continue, value changes etc..) in the Web Interface.  This allows multiple people to monitor the same project and input at the same time.


Remote Access

If you enable access to your PC from the internet to two ports, you can access the Web Debugger from anywhere in the World, and even have multiple people sharing the session!

Support for Dynamic DNS (e.g no-ip) can make forwarding multiple ports using your router simpler, and may be in-built with your router software, check your specific Routers' instructions for DDNS and Port Forwarding.

If you plan to host the Web Files elsewhere, then you only need to forward the REMOTEWEBSOCKETPORT, meaning alternative options such as ngrok can be used without charge.

To Enable Remote Access:

Follow the same steps as above, however when editing the batch script, also supply the values for the REMOTEWEBSOCKETADDRESS and REMOTEWEBSOCKETPORT values as needed.


(Ex-)Portable

If you find that you have the debugger displaying all the information you need, you can take the project, and a copy of the <<yourProject>>\__vm\vmWebDebugger folder to another PC (from home to school to get help for example).  Simply edit the Serial and Socket ports as needed for the setup on the new machine, and run as normal!
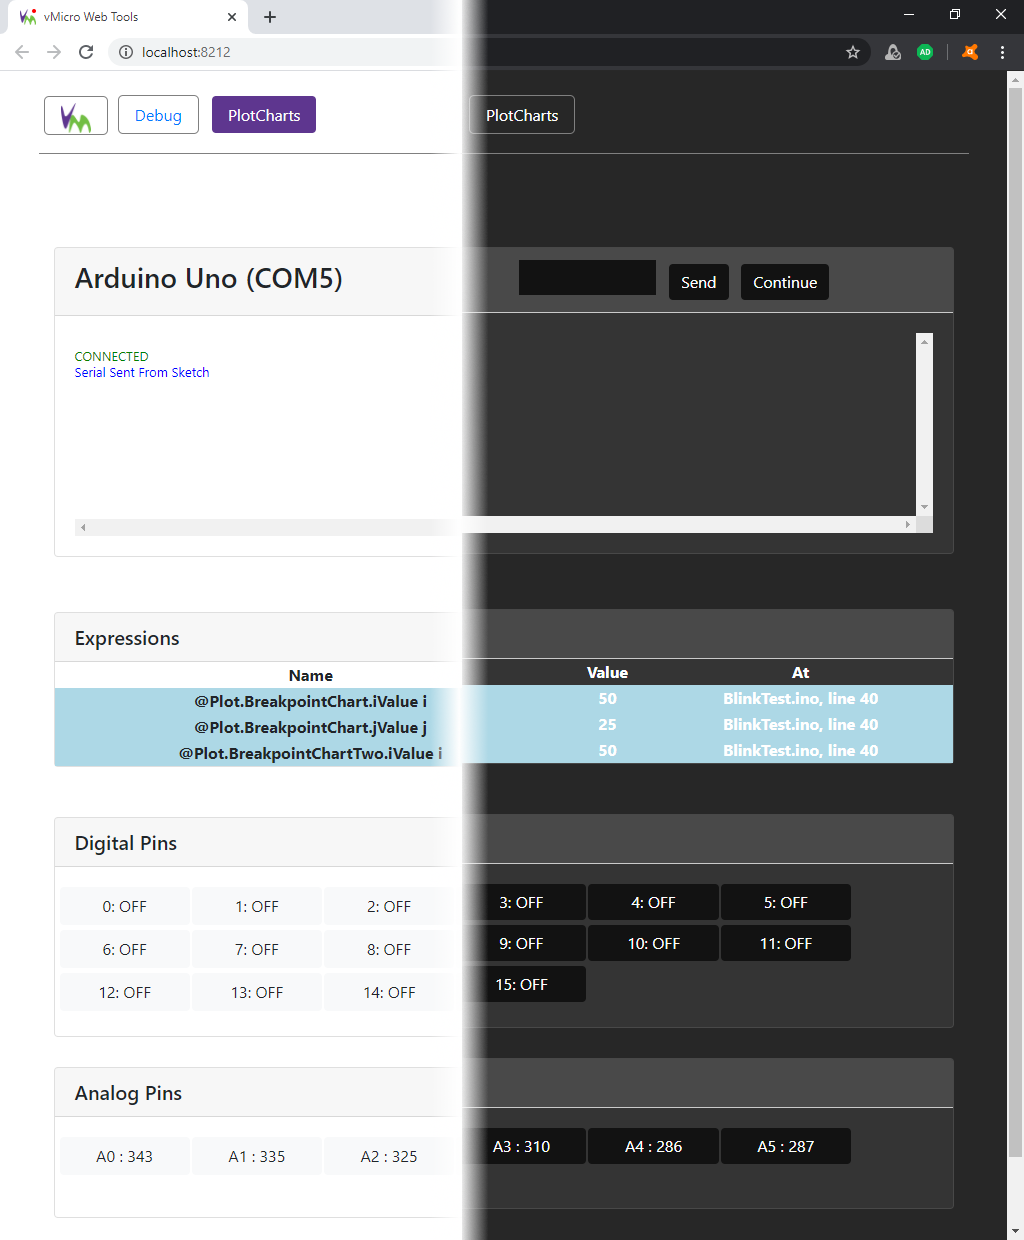
 

Theming

Increasingly accross different devices Light and Dark Themes are used to make things clearer and easier on the eyes. The Web Debugger has these initial themes considered, and it will automatically adapt to the device it is loaded on.


Web Debugger: Light and Dark Themes (Left and Right)


Getting Started?

Select the Serial Debugger, and add your break points, actions and @plot commands as usual to your sketch.

Navigate to the vMicro > Debugger  Menu and select "Export Web Debugger (Experimental)"

Build and Upload your sketch to your board as normal via the Serial Port selected.

At the end of the Output from your upload there will be some links:


  1. Click the one highlighted here to open the Web Debugger folder


  2. Output Window: Links for Export Web Debugger


  3. Edit the "Start-WebServer.bat" file, and check and amend the below as needed:
    • the SERIALPORT and BAUDRATE values are correct for your board
    • the IPADDRESS is correct, leave as 127.0.0.1 to use just on your PC, change to the relevant IP Address if accessing via other machines on Wifi/LAN
    • the HTMLPORT and WEBSOCKETPORT are not ports you are using for other applications (very unlikely)
  4. Save and close the file
  5. Double Click it to run the Web Debugger (or click the second link shown in the output window above)

  6. Note Icon Note

    In the current version:- Please watch out for the following:-
    • if Windows Asks for Adminstrative access / Network Access for MicroWebserver.exe, say Yes as this is required
    • NOTE - if your Anti-Virus flags this program as a problem, add an Exception as it is not malicious and can be flagged due to its network access.
  7. Now you should have a Command window loaded (below left), and a Web Page will appear in your default browser, loaded to the web debugger:

To Quit the web debugger simply close the web page and the command window.

Navigating the UI

The features will appear and hide depending on the options selected in the Serial Debugger.

The Serial Monitor and Debug controls / watch data / code preview are all on the first tab, with all @Plot Charts displayed on a seperate tab.

Web Debugger: Stopped on Breakpoint with Editable Watch Expression
Web Debugger: @Plot Chart View

Video Guides

Below are some videos to take you through using this feature.

More will be added soon so please check back, or subscribe to our YouTube Channel here.


#1: Serial to Web Debug UI for Arduino

This will take you through using this feature for the first time, and shows break/tracepoint setup as well as the main features of the Serial Web Debugger