FAQ | [No Additional USB Drivers Needed]
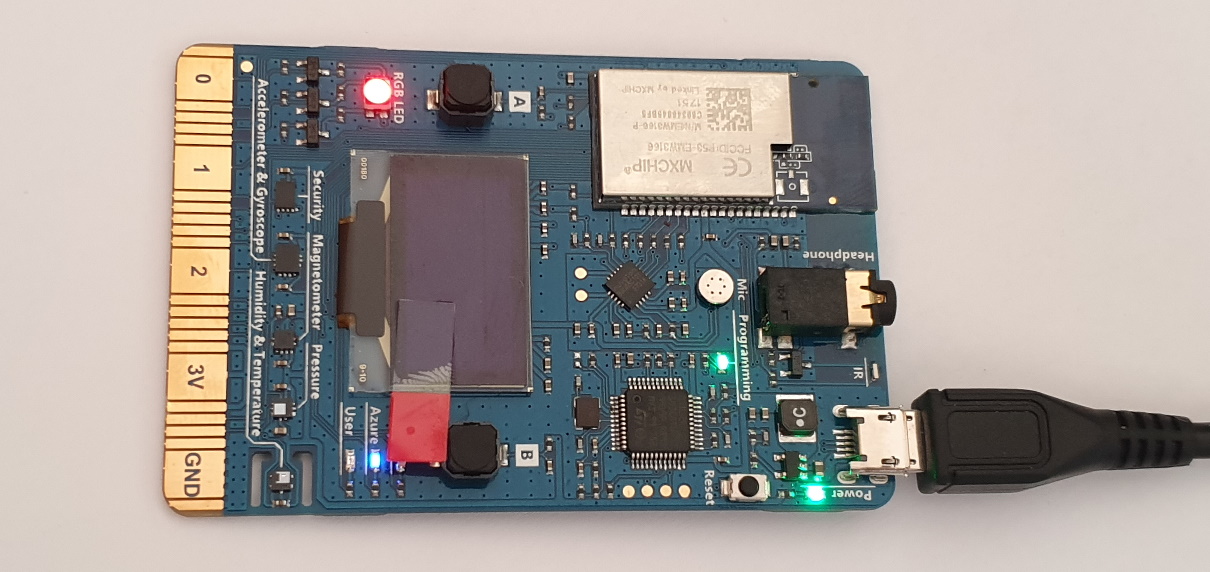
The MXCHIP AZ3166 is a powerful development board with a built in STLink 2.1 programmer / debugger, running the STM32F4 CPU which together deliver an on-board debugging solution.
External Debug Interface: SWD
NOTE - Azure Bootloader
Performing Arduino code uploads will remove the Azure Bootloader which is on-board.
This can be easily restored at any time by copying the BIN file back to the "USB Storage Device" which is presented to your PC.
More information about re-flashing this bootloader can be found here
Debugger Connections
There are no further connections to make beyond the USB lead as all USB/Serial communcations to the AZ3166 run via the STLink v2.1 on-board.
Software Setup
Ensure you have Visual Studio and the vMicro Extension Installed
Open your Sketch and select the Debug > Hardware > STLink v2.1 (Onboard)

Start Debugger
- Ensure you have the Debug Configuration selected from the Configuration Manager Window
- If you know where you want the first breakpoint in your code, add it now
- To start the debugging process, you can either:
- "Debug > Attach to Process" button if your code has already been uploaded to the AZ3166 board
- "Debug > Start Debugging" if your code has not been uploaded
Congratulations - you should have the debugger running, and further windows can be opened from the "Debug > Windows" menu once you have started debugging