The wide variety of SAMD based boards are now available out of the box for debugging in vMicro, through onboard or external debuggers.
External Debug Interface: SWD
Some SAMD Boards come with a debugger built into the board, as with the Arduino M0 Pro and Arduino Zero boards, which removes the need for an external hardware debugger.
Built-In Debugger Connections
If you have a board with an built in debugger, ensure you know which port is for debugging and which is for normal programming, only the DEBUG port needs to be connected.
No further connections are required beyond the USB Lead.
e.g. Arduino M0 Pro Debug Port

External Debugger Connections
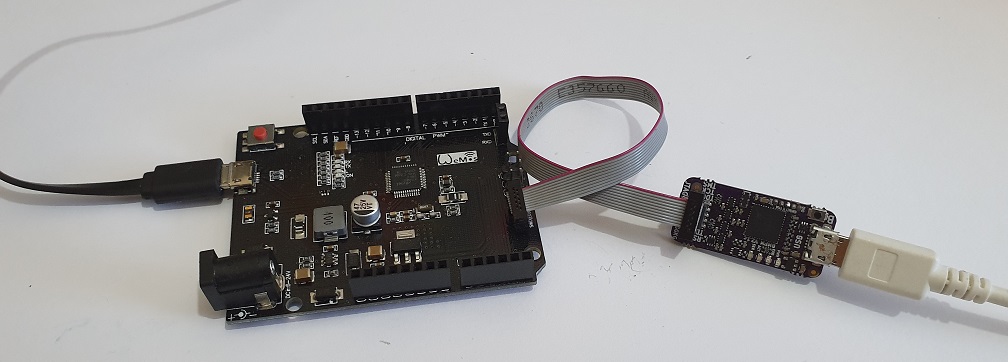
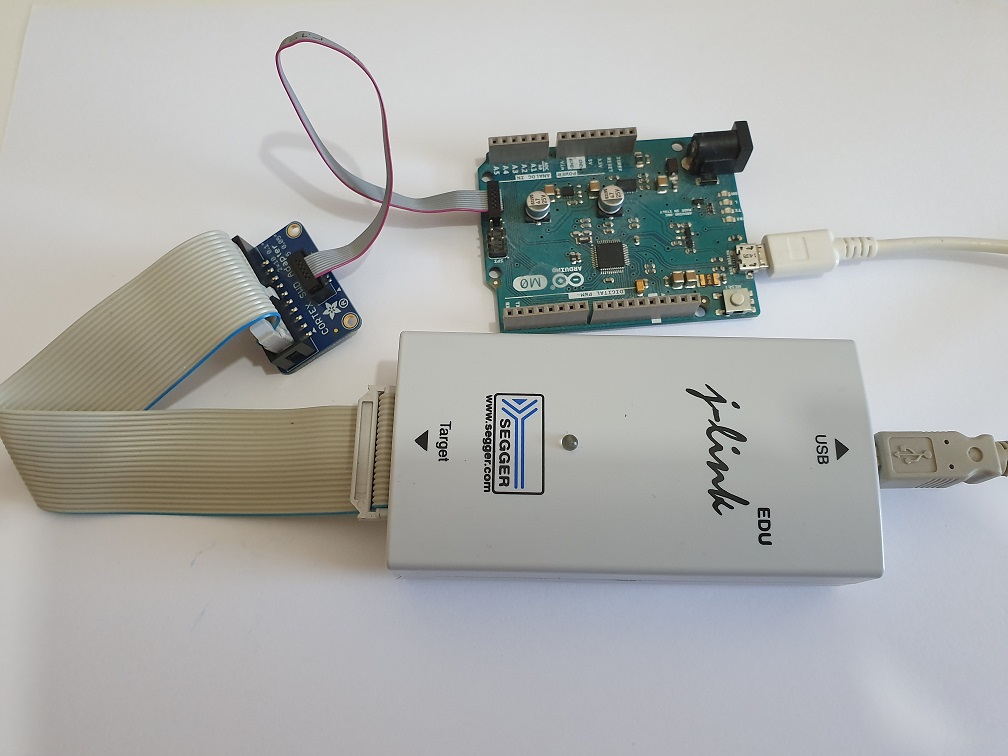
If you don't have a debugger built-in then you can use an External Debugger which supports SWD to attach to your board, as seen in the examples below.
NOTE - SWD Interface Connections
On Boards - often just specific pins on your board, or may be presented in a 2x5 interface (its small at [0.05"/1.27mm pitch]), shown in the first image on the "Black Magic Pro" debugger
On Debuggers - may be presented in the small 2x5 interface, or in the JTAG layout.
Bear this in mind when finding a debugger, you may need more leads / breakouts to connect them to your targets.....
Software Setup
Ensure you have Visual Studio and the vMicro Extension Installed
Open your Sketch and select the Debug > Hardware, and the relevant Debugger you have available, whether it's built in, or External:

You may need to install an additional USB Driver on Interface 0 of your debugger to allow it to function with this software - check in the debugger list here
Remember - If you have installed a new driver, you may have to do it again if you connect the debugger to a different USB port next time.....
Start Debugger
- Ensure you have the Debug Configuration selected from the Configuration Manager Window
- If you know where you want the first breakpoint in your code, add it now
- To start the debugging process, you can either:
- "Debug > Attach to Process" button if your code has already been uploaded to the SAMD board
- "Debug > Start Debugging" if your code has not been uploaded
Black Magic Note - You will need to set the COM port to the BMP port to DEBUG, so can only set Board COM Port, "Build & Upload", swap to BMP COM Port and then "Attach to Process"
Congratulations - you should have the debugger running, and further windows can be opened from the "Debug > Windows" menu once you have started debugging
See our GDB Debugging in Brief guide, or our detailed GDB Debugging Tutorial for Arduino to learn more about using the debugging interface.