GDB Debugging Tutorial for Arduino
This tutorial refers to the gdb debugging features that are available for many Arduino or compatible boards.
All of these options are available on the " vMicro > Debugger > Hardware Debugger " menu where supported or Visual Micro also provides a VsCode compatible custom debugger for advanced users.
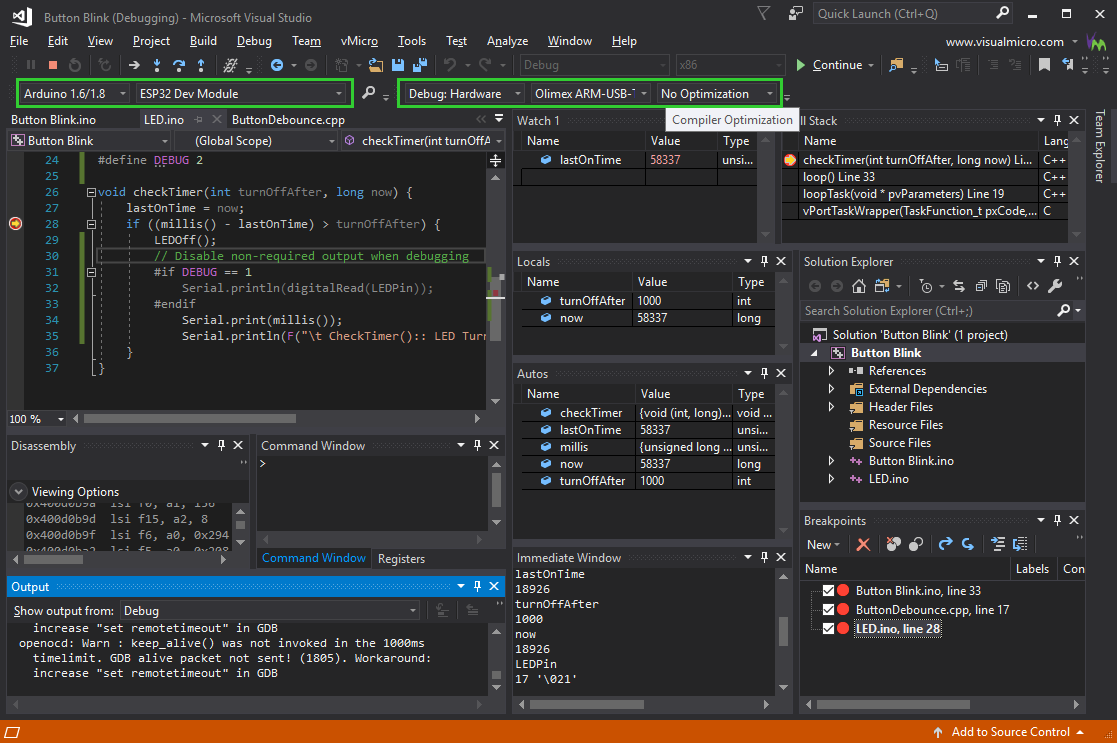
Overview of the debugging windows that Visual Studio/Visual Micro offer
Who Should Read this Tutorial
This tutorial is for you,...
- ...if you are new to the concept of debugging (using a debugger) in general
- ...if you already debugged other systems but are new to debugging with Visual Studio/Atmel Studio
- ...if you already know the basic debugging features of Visual Micro and want to learn which new features Visual Micro gdb Debugging offers.
If you are already familiar with debugging in Visual Studio, probably from "classical" Windows development,
then the tutorial won't bring much new information, since most functions of Visual Micro
gdb Debugging just work as you know them.
Instead, you may want to read this document, that focuses on the differences between debugging Windows applications and Visual Micro Advanced Debugging.
Gdb Debugging in Brief
If you do not want to spend the time to work through this tutorial, you can also read the documentation on
this page.
The Tutorial Project
The Tutorial does not require you to learn and
understand how the Tutorial code works. Its only use is to have some
code to practice debugging. The Tutorial code does not contain any
(intentional) bugs. The tutorial does not cover techniques for bug
fixing, but concentrates on using the debugging functions of Visual
Micro.
The tutorial project is a controller for the traffic lights at a road crossing:
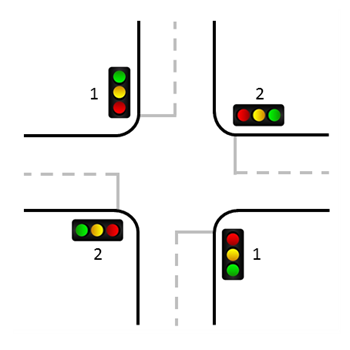
The two lights marked "1" and those marked "2" are identical. The controller
takes care that there is a sufficient time where both traffic lights show red.
In the source code, an traffic light as a whole is referred to as "light", the individual lamps within
a light are referred to as "lamps".
The Circuit
The Tutorial project requires a minimum of external hardware. You can also work through the tutorial without this hardware, with your board alone, but experimenting with debugging is more fun with these LEDs attached.
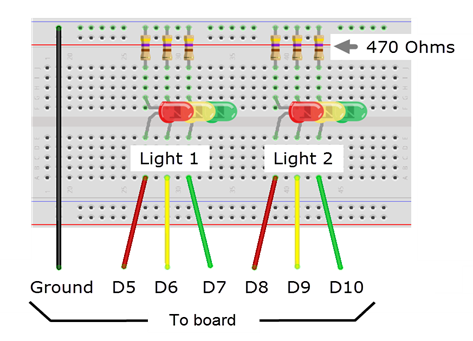
As the breadboard image shows, there are three LEDs connected to pins D5 and D8
(red), D6 and D9 (yellow) and D7 and D10 (green), each in series with a 470 Ohms
resistor to ground. Remember that LEDs need the correct pin orientation, the
longer of both pins is the anode, which is connected to the board's output,
while the shorter pin, the cathode, is connected to the resistor.
Preparing the Tutorial Project
This Tutorial uses a simple project as an example.
Download the project
from here and unzip it into a folder of your choice,
then open the solution Traffic_Light.sln in Visual Studio.
Make sure these  settings match the one shown here:

Set the COM port 1 according to the port that your board is attached to.
Part 1: BreakpointsDOWNUP
Starting the Tutorial Code - Your First Breakpoint
The fundamental elements of debugging are breakpoints. A
breakpoint is a location in your code where the running code stops and hands
over control to the debugger. The code is halted and everything in your board is
frozen at that point.
Start the tutorial code as usual by clicking on  or by pressing F5.

If
Tutorial Mode is
Enabled, and you have not yet set a breakpoint/tracepoint,
Visual Micro will set a tracepoint
for you, at the start of the
setup() function.
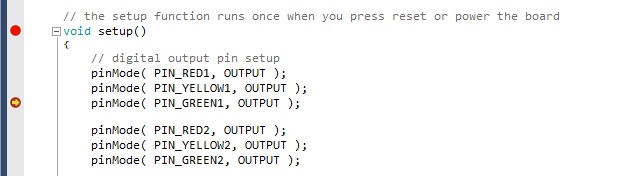
For this Tutorial right click the tracepoint > Conditions > Uncheck "Continue code execution" at bottom, converting it to a breakpoint.
After this, learn more about
these options on this page.
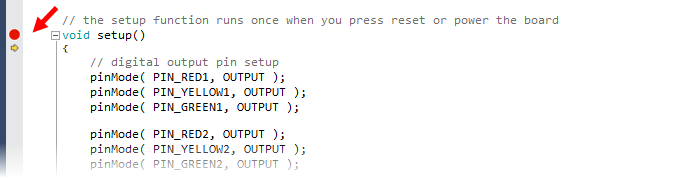
(The fact that the yellow arrow is one line below the breakpoint, has technical
reasons. For the debugger, the function starts at the opening "{").
Now, we set a breakpoint of our own: Click on the gray sidebar at the line "pinMode( PIN_GREEN1, OUTPUT )",
you can also move the cursor to this line and press F9.
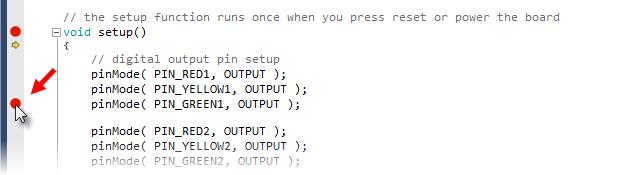
Now we want to continue the sketch. Click
or press F5.
As you see, the yellow arrow jumped to the new breakpoint. The board executed the "pinMode(...)" commands after the first breakpoint and halted in the second.
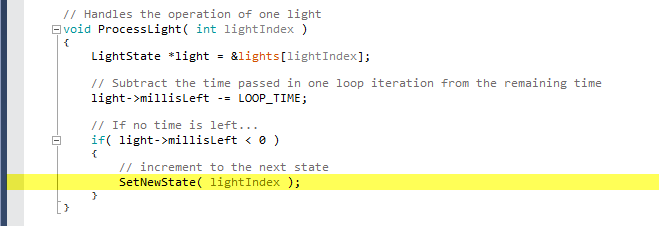
Now try it yourself:
Please set a breakpoint at the line marked yellow
below, inside
the ProcessLight() function:
Continue the sketch by clicking
or pressing F5.
Your sketch will run until this line, this is an example of a breakpoint in
the middle of a function. With every ,
the sketch will run and halt in the breakpoint again. In the time between, you
will see that the lights are changing, from red, to green, to yellow, and back
to red.
Learning:
By setting
breakpoints, you can see if and when a certain line of code is reached.
By setting multiple breakpoints, you can follow the order of execution.
Breakpoints with gdb Debugging use special
hardware registers in the board's processor. Therefore, you can only set
3 breakpoints at a time.
Visual Studio allows to set up to 4 breakpoints, but experience showed
that more than 3 breakpoints make the debugging session unstable.
Deleting, Enabling, and Disabling of Breakpoints
You can delete a breakpoint in the same way as you have set it: By clicking
in to the gray sidebar or by pressing F9. Sometimes it is
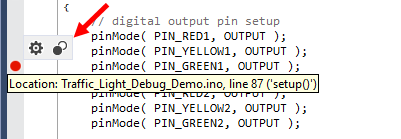
preferred to only disable a breakpoint. Disabled breakpoints have no
effect and do not stop your sketch. A breakpoint can be disabled by pressing
Ctrl+F9, or by hovering the mouse over the red breakpoint dot and
clicking  .
In the same way, you can enable the breakpoint again.
.
In the same way, you can enable the breakpoint again.
The Breakpoints Window
In larger projects, you maybe lose track of where your breakpoints are. Here
the Breakpoint Window can help. Choose Debug > Windows > Breakpoints
or press Alt+F9. The Breakpoints Window appears:
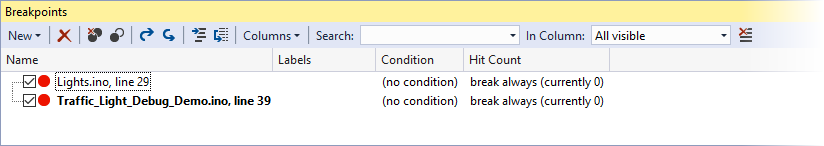
You can jump to the line where a breakpoint is set by double-clicking on the
list entry. You can enable and disable it using the checkbox.
Learn more about the Breakpoint Window.
Part 2: SteppingDOWNUP
A powerful feature of debuggers is Stepping - it is a
feature exclusive to Visual Micro gdb Debugging and not available
with Visual Micro Basic Debugging.
Stepping is executing code one line at a time.
Let's try out!
Please delete all previous breakpoints, Visual Micro will set a
breakpoint at the start of setup() automatically.
Then start your sketch.
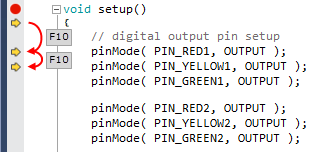
The sketch will be halted at the breakpoint.
From now on, we can single step by pressing F10. The yellow
arrow shows the current line:
If you reach the end of the function, then subsequent single steps with
F10 will bring you at the location where your function was
called from.
Stepping into code
As you saw, with F10, you step over function calls.
The F11 function key lets you step into the called function.
To try this out, set a new breakpoint at the SetNewState(...) function call
in the ProcessLight(...) function:
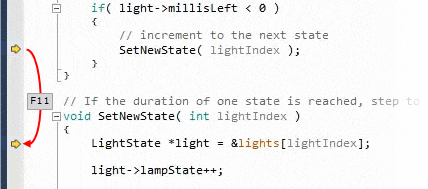
Press F5 until your board reaches this location. If you
pressed F10, you would step over the function call. With
F11, however, you step into the function SetNewState
Stepping out
The Step Out function (Shift+F11) continues execution until
the location is reached, where the current function was called.
The example below shows how to step out of a call to ProcessLight, back to
the location where the call took place. After pressing Shift-F11,
all code in ProcessLight is executed without
interruption, until the function is exited (symbolized by the  in the image below).
.png)
Set next statement
Visual Studio's function "Set Next Statement" (Ctrl+Shift+F10) is unreliable with Arduino debugging and should not be used.
Part 3: Data TipsDOWNUP
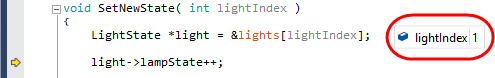
Data tips are small tool tip windows that appear when you hover the mouse pointer over a variable.
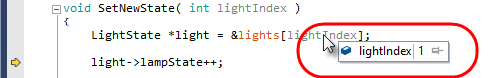
In the case of more complex variables, like class objects or structures, you can also unfold the structure
by clicking on the arrows in the data tips.
The pin symbol allows keeping the data tip open if you move the mouse away
from the variable. The value shown by the data tip shows will be updated if code
execution returns to this code line.
The data tip will be updated every time the sketch passes the location where
the data tip is placed and was pinned.
You can also use the data tip to change a variable's value on the board.
Simply click into the value field and enter a new value.
Part 4: Watch, Auto, and Locals WindowsDOWNUP
The Watch Window
Visual Studio lets you open up to four Watch Windows, which all work in the same way
Open Watch Windows with Debug > Windows > Watch > Watch 1 through Watch
4
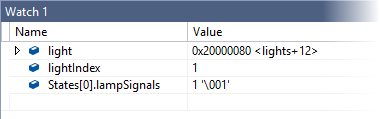
The Watch Window is used to view variables of your choice continuously. After opening a Watch Window, enter a variable name or expression
in the left column of the watch window and its value will be shown right beneath it. You can also change a variable's value by overtyping it in the watch window.
Variables that are not accessible at the current code location will remain in the watch window, but will not be displayed
In the above example, 'light' is a structure (or class object). Therefore, you
can open it by clicking on the arrow symbol left of it.
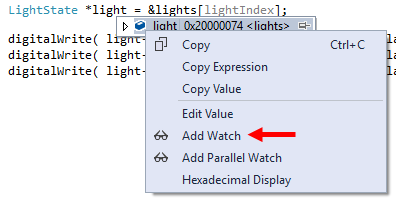
Instead of entering variables names, you can also drag and drop a variable na<me
from the editor to the Watch window, or you can choose "Add
Watch" in the context menu of the editor or the context menu of a data tip:
The Locals Window
Open the Locals window with Debug > Windows > Locals
The Locals window is like an automatic Watch window that
always displays the local variables in your current function.
It can be used like a Watch window (see above).
The Autos Window
Open the Autos window with Debug > Windows > Autos
The Autos window is like an automatic Watch window that displays variables used in the current statement and a few statement before.
It can be used like a Watch window (see above).
Part 5: The Call StackDOWNUP
This and the following pages of the tutorial cover various useful windows
that Visual Studio/Visual Micro provide, that can be used for various
debugging purposes.
Open the Call Stack Window with Debug > Windows > Call Stack
The Call Stack window shows you, the sequence of
function calls that lead to the current code location.
Let's try it out.
- Delete all breakpoints except for the one that was automatically set at the start of setup().
- Set at breakpoint inside the SetLightSignals() function in the lights.ino source file.
- After starting your sketch, and after the code halts in the setup() breakpoint, press F5 to continue.
- The sketch will halt in the SetLightSignals() breakpoint.
- Now open the Call Stack window with Debug > Windows > Call Stack,
if it is not already open
The Call Stack window will look like this:
.png)
It shows what functions have called other functions to get to the current
location. loop() has called ProcessLight(), which has called SetNewState(),
which has called SetLightSignals().
The 'main()' at the end of the list is a function from the Arduino core that has called your loop() function.
Before we continue, please open a Locals Window, as described on the previous page. As expected, it shows the local variables in the current function.
Let's double click on the second line of the Call Stack
window, the one with SetNewState(). The cursor
jumps to the exact location, from where SetLightSignals() was called.
Look at the Locals window: It now shows the local variables of SetNewState().
All similar windows, like Autos and Immediate,
also behave as if we were in SetNewState(), not in SetLightSignals().
This also applies to Data Tips.
If you have navigated through your code in the
editor and want to get back to the current line of execution
(indicated by the  ,
then double click on the uppermost entry in the Call Stack. It brings you
back to the current line of execution.
,
then double click on the uppermost entry in the Call Stack. It brings you
back to the current line of execution.
Any execution step (Step Into,
Step Over...) sets the current function back as being the active function, so
all windows like Locals, Autos etc. operate with the current function again.
Part 6: Where to go from hereUP
Up to this point, you have learned about the most important featured of Visual Micro gdb Debugging.
We recommend experimenting a little on your own from here.
The following pages contain information about advanced features that are not part of this tutorial,
but offer powerful features you may be interested in:
-
"gdb Debugging in Brief" describes a few
more windows, like the Immediate, the Command, and the Disassembly window.
-
"The Breakpoint Window" describes useful details about the Breakpoint window.
-
"Working with Breakpoints"
describes additional functions that breakpoints have to offer, like
conditional breakpoint and breakpoint actions.
Last but not least: Debugging can be impeded by compiler optimization.
The
tutorial code considers this already, but you should read this section to learn
how to manage optimization yourself.
Thank you for passing the tutorial!