Keep Track of Your Breakpoints: The Breakpoint Window
Visual Studio's/Atmel Studio's Breakpoint Window gives you an overview of
all breakpoints you have set in your project.
With the Breakpoint Window, you can...
- Get a tabular overview over all breakpoints
- Selectively enable, disable and delete breakpoints
- Search for breakpoints
- and much more
You open the Breakpoint Window with the menu item
Debug > Windows > Breakpoints or by pressing [Alt+F9].
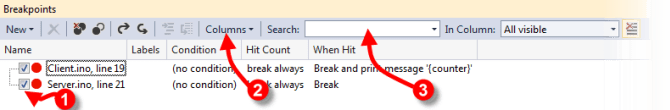
With the checkboxes 1, you can
select breakpoints for subsequent operations (see 5 through 7 below.
With the column selector 2, you can add more columns (breakpoint properties) to the
display.
With the search box 3, you can enter
a search term, after pressing [Enter], the list shows those breakpoint that
match the search criteria.
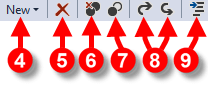
4 lets you create new
breakpoints
5 lets you delete the breakpoints
that have the checkbox 1 checked.
6 lets you delete all
breakpoints shown (which may be filtered by the search criteria 3).
7 lets you delete all
breakpoints shown (which may be filtered by the search criteria 3).
8 lets you export all
breakpoints to or import from a XML file.
9 Jumps to the source code
location of the selected breakpoint.