Debugging Tutorial - Part 3: Text Output with Breakpoints
In the previous part of this tutorial, you have seen that you get valuable information
from breakpoints in the output window.
But it is tedious to see what's going on in your code, if you only see names
of source files and line numbers.
That's where "Breakpoint Action" (also called "When Hit" actions, depending on your
IDE) are helpful: They allow you to display individual text in the output window.
First, we want to delete the old breakpoint and set two new breakpoints. And
we must change the code a little, so it can be used with breakpoints/tracepoints.
- Add curly braces to your sketch code as shown
below:

The missing curly braces would prevent us from setting
breakpoints successfully.
Although we use an original example sketch from
www.Arduino.cc, the author
of the sketch violates a best practice, namely to always use curly braces with
"if()" statements. (Read more
about why this rule makes sense)
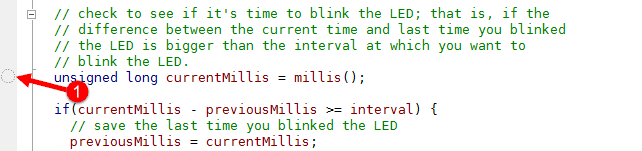
- Delete the current breakpoint at
previousMillis = currentMillis (Position
the cursor in this line and press [F9]) - 1
in the screenshot below:
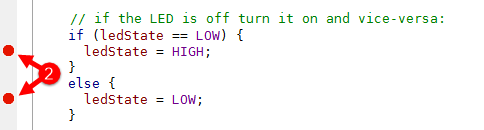
- Set two new breakpoints at
ledState = HIGH and
ledState = LOW - 2 in the screenshot
below:
Please make sure that we are still in "tracepoint" mode by checking vMicro > Debug Trace Only, as shown in
part 2 of this tutorial.
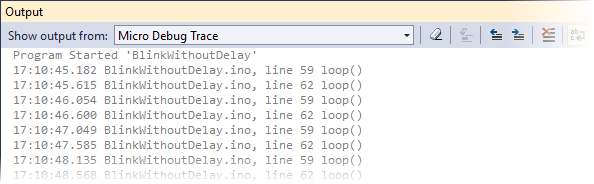
If you now build and upload your sketch (with the
 toolbar
button or vMicro > Build & Upload),
you will see this in the output window:
toolbar
button or vMicro > Build & Upload),
you will see this in the output window:
No we want to make this output more meaningful by using text output in our breakpoints.
- Right click on the upper of both breakpoints
and choose "Actions" or "When Hit..." from the context menu:
Context menu in Visual Studio 2015:
Context menu in Visual Studio < 2015
and Atmel Studio:
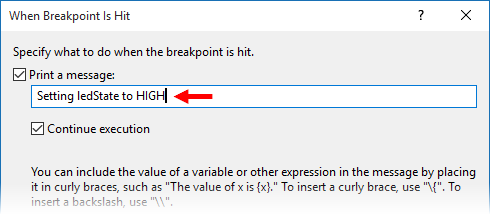
A window opens, where you can enter the message you want to be shown
when the breakpoint is hit.
In Visual Studio 2015:
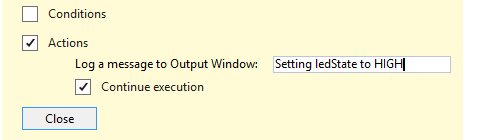
(The "Continue execution" has no meaning in our exercise.)
In Visual Studio < 2015 and Atmel Studio:
(The "Continue execution" has no meaning in our exercise.)
Note that the text regarding "special keywords" further down in the dialog
is intended for Microsoft Visual C++ programs and does not fully apply to
Visual Micro (read
more).
- Repeat this step with the second breakpoint
and enter "Setting ledState to LOW" as the breakpoint text
- Stop your sketch by clicking on the "Stop"
button
 on
the toolbar
on
the toolbar
- Start a rebuild and upload by pressing [F5]
While to code runs, your text will appear in the output window:
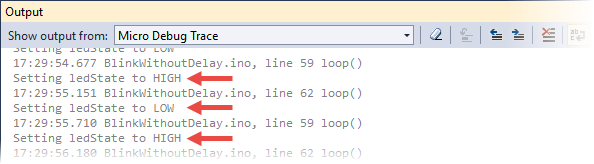
As you see, using meaningful text with breakpoints/tracepoints makes it much
easier to identify the code locations that are passed.
Text Showing Variable Values
You cannot only show static text, but also the current values of variables in
your sketch. This is a very powerful tool for inspecting your program.
Variables can be inserted into the "When hit" text by simply putting the variable
name in curly braces:
- Right click on the upper of both breakpoints
and choose "When Hit..." from the context menu again
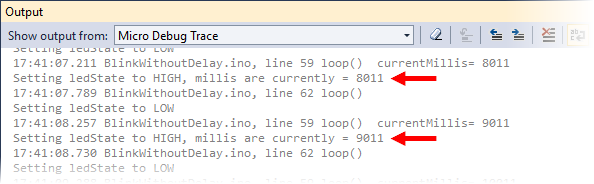
- Enter "Setting ledState to HIGH, millis are
currently = {currentMillis}"
- Stop your sketch by clicking on the "Stop"
button on
the toolbar
- Start a build and upload your sketch (with the
toolbar
button or vMicro > Build & Upload)
Here is how the output window will look like:
You will also notice that the "Expression Window" appears.
This page
explains in detail how to use the Expression Window and how to display and change
variables with breakpoint text instructions. Both is not part of the tutorial, but
of the further reading recommendations, for a complete list
see part 4 of
this tutorial.
You can now continue with part 4 of the tutorial:
4.
More Debugging Functions