Debugging your Arduino Sketch Visual Micro
What is Debugging?
Please read
this introduction
first to learn the basic concepts around debugging.
How do I Enable Debugging in Visual Micro?
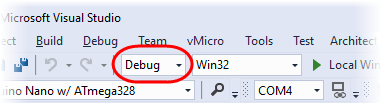
Debugging requires that you use the Debug configuration of your project.
To select this configuration, choose "Debug" in the configuration selector
in the Visual Studio/Atmel Studio toolbar:
(This page tells you more about
configurations, but for now, you only must remember to choose "Debug".)
This toolbar field besides Debug/Release:  has no meaning to Visual Micro.
Debugging is only switch on and off with this
setting, if you have "Automatic Debugging" switched to "On"
(Read More).
If "Automatic Debuggung" is switched off, then the Debugger is
enabled/disabled by the project property settings,
and not by the Debug/Release configuration setting shown above.
What is a Breakpoint?
The key element in Visual Micro debugging is breakpoints.
A breakpoint is a marker that you can set in a source code line where execution
shall be halted. Once your program reaches the breakpoint, it stops and begins communicating
with Visual Micro. Afterwards, you can instruct your Arduino board to continue
execution of the sketch.
What Can You Do With Breakpoints?
- By setting multiple breakpoints you can follow the flow of execution inside
your program. For example you can check when certain functions are called and
in what sequence.
- You can configure the breakpoints...
- so that execution is not halted, but only logged, so that you can observe
the flow of execution while your program is running uninterrupted (so called
Tracepoint). Visual Micro shows every breakpoint your program passes
in a window. Then your breakpoint is like a track marshal in sports. This
is the default setting for new projects.
- so that your sketch is halted every time a breakpoint is hit. The sketch
will resume execution when you press [F5].
- When a breakpoint is hit, you can watch the values of variables and can
even change them (read
more).
- You can define conditional breakpoints. These breakpoints only stop program
execution if a certain condition is met, for example a variable value. You can
also define breakpoint counters, so that a breakpoint only stops after the program
has passed it a certain number of times.
You can find a complete description of the breakpoint functionality
on this page.
First Steps: Working With Breakpoints
The following example uses the Blink sketch from Arduino.
- Put the cursor on an instruction in your program
code
- Press [F9].
- This sets a breakpoint at this code location. Your
screen will now look like this:
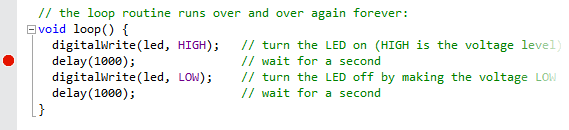
The red circle on the left indicates your breakpoint
You can also set a breakpoint by clicking into the gray shaded are left of the
code, where the red circle appears.
- Compile, upload and run your program by pressing
[F5]
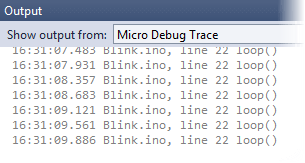
- Your program starts to run. Every time it hits
the breakpoint you will see a notification in the Micro Debug Trace window:
After making changes to your breakpoints (adding, deleting, modifying), you
have to recompile and upload your sketch in order for the changes to go into
effect.
However, enabling and disabling breakpoints can be done at any time
without
having to recompile and upload.
Read more about differences between
the Visual Micro debugger and normal debuggers.
Breakpoints and Your Code
Where Breakpoint can be set
In a nutshell, you can set a breakpoint wherever you could insert a normal statement.
In fact, Visual Micro breakpoints are small pieces of extra code that Visual
Micro inserts in your sketch.
Where Breakpoint cannot be set
Breakpoints cannot be set in:
- Library code: If you want to set breakpoints in library source files, add these files to you project as normal source files, instead of adding the library.
- Interrupt service routines (ISR): In order to
debug ISRs, you need a hardware debugger, no software debugger like
Visual Micro's
Breakpoints in Comments and Empty Lines
Setting a breakpoint on a comment line has no effect, the breakpoint will be
ignored.
Setting a breakpoint on an empty line has the same effect as setting it on the
next non-empty line.
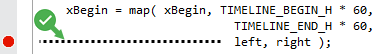
Breakpoints in Multiple Line Statements
If you want to set a breakpoint at a statement that spans multiple lines, then
set the breakpoint at the last line of that statement (where the ";" or the "}"
are located):
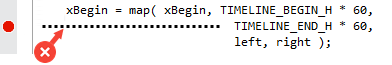
Violation of this rule will result in compiler errors.
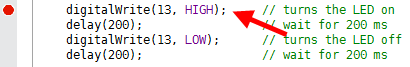
The Exact Location of a Breakpoint
If you have set a breakpoint at a specific line, the instructions in this line
will be executed before the breakpoint is hit. So the exact location of a breakpoint
is after the last instruction of a line.
See example below: The instruction
digitalWrite(13, HIGH) is first executed and then
the sketch hits the breakpoint (red arrow).
In this aspect, Visual Micro works differently than other debugging
enabled development environments.
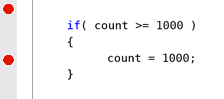
This is also true for 'if's, and for 'while' or 'for' loops,
Example: In this 'if' statement, the breakpoint is set inside the 'if' block,
i.e. it only breaks if 'count' is greater than 1000:

while in this statement, the breakpoint is set outside the 'if' clause,
because the 'if' statement ends with the semicolon:

If you are unsure where a breakpoint will be located, simply add an empty
line to your code and set the breakpoint there. And/or use curly brackets:
Never set a breakpoint at a 'switch' line, such a breakpoint will
never be hit:

Setting it on any other line is OK, e.g. the 'case' statement or the
'count = 499' statement.
Differences Against "Classic" Debuggers
Users with a background from PC based development environments and debuggers
may read this page to learn
about the differences between these systems and Visual Micro in terms of
debugging.
Debugging and the Serial Port
The Visual Micro debugger uses the serial port for communication
with the board. If you use the serial port yourself in your sketch, then make sure that the baud rate set by your code (with
Serial.Begin)
matches the baud rate that Visual Micro uses for debugging. You can
set Visual Micro's baud rate with
these project settings.
If you use Serial read functions (like
Serial.Read),
be prepared to receive characters from the Visual Micro debugger,
depending on the position of your breakpoints.
As long as you only send strings to the PC using serial functions,
you won't experience any interference between Visual Micro's debugger
and you own usage of the serial port.
To avoid such interference, you can use separate ports for these two purposes. This
article shows you how to do this:
"Debugging with Different Ports, Pins and Speeds".