Drawing Graphs Using @Plot Windows
The Plot Window can be used to display values from your board as a curve.
You instruct Visual Micro to plot a curve by using the @Plot keyword in a
breakpoint Action (Read more
about breakpoint actions here).
The following example shows a @Plot command in a breakpoint
action field:

If you start your sketch, a window will appear that plots the value of
'voltage' as a curve:
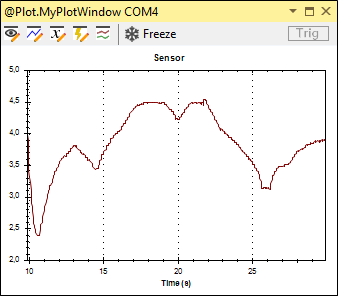
The Y axis will be scaled automatically, depending on the values coming in,
so you won't have to adjust it. The curve will always fit into the chart.
By Default, the curve will only be updated if a
new data point comes in, i.e. when a breakpoint with a @Plot action text
is hit.
If such breakpoints are only hit rarely or in irregular
patterns, it might be better to switch to a fixed, timer controlled, display update rate.
Use the "Display" settings icon  on the toolbar to change the display update rate.
The @Plot command
With the @Plot command, you are able to control the appearance of curves in a
wide range. That's why it makes sense to take a closer look at the anatomy of
the @Plot command:
1
Don't forget to put curly brackets around the @Plot command
2
This is the @Plot keyword that instructs Visual Micro to create a plot window and to send the values to it
3
This gives your plot window a name. With this window name, you can control how many windows will open.
If you have multiple @Plot commands with different windows names, Visual Micro will open multiple windows.
All curves with the same window name will appear in the same window.
4
This gives the curve a name, in this example "Sensor"
5
This is the expression that shall be shown as a curve.
You can use simple variables as well as more complex expressions etc., as described
here.
A Video Example
See the below Youtube video to see the @Plot command in action, and read on to find out all of the other options available!
Multiple Plot Windows
You can have multiple plot commands,
either in separate breakpoints, one command per breakpoint, or in one breakpoint, one command after the other,
like this:
{@Plot.MyPlotWindow.Sensor.Green voltage} {@Plot.MyPlotWindow.Temp.Blue temperature}
As mentioned under 3 above, the window name controls, to which
window the value will be sent.
Example: These three @Plot commands will create one window with three curves:
{@Plot.MyPlotWindow.Sensor.Green voltage}
{@Plot.MyPlotWindow.Temp.Blue temperature}
{@Plot.MyPlotWindow.Direction.Green direction}
These commands will create three separate plot windows with one curve each:
{@Plot.MyFirstPlotWindow.Sensor.Green voltage}
{@Plot.MySecondPlotWindow.Temp.Blue temperature}
{@Plot.MyThirdPlotWindow.Direction.Green direction}
Plot Window Settings
The four buttons in the toolbar of the plot window can be used to change the plot window's appearance and
behavior.
Lets you set display properties, like the display refresh rate, line width of all curves, etc. (*)
 Let's you specify the curve appearance, like curve color, curve line ticks, and the curve's name as displayed in the chart (*)
 Lets you specify properties of the X axis, like sweep time,
and time format. (*)
Lets you specify properties of the X axis, like sweep time,
and time format. (*)
 Lets you configure the trigger function, see explanation below
(*) Get more information from the balloon help windows that show
up if you hover the mouse over a settings fields.
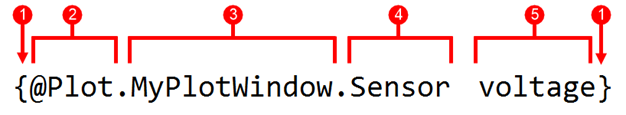
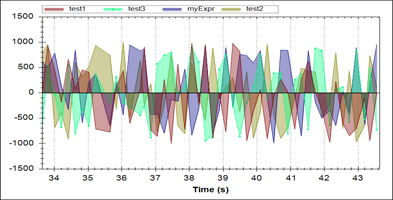
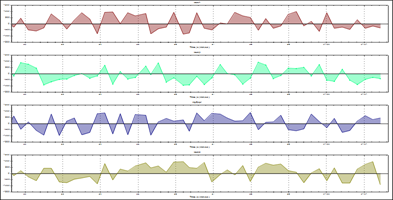
 Lets you switch between
two different views: A
view where all curves share the same chart, and a view where curves are drawn
in their own chart under each other:
Lets you switch between
two different views: A
view where all curves share the same chart, and a view where curves are drawn
in their own chart under each other:
If your values have very different ranges of Y axis values, it makes sense to
choose multiple chart view, because then each curve will have its own Y axis
scaling. One example is an analog signal ranging from 0 to 1023, and a
binary signal that only can have the values 0 and 1. If they were plotted in the
same chart, you wouldn't be able to see the binary signal, because, due to the Y
axis scaling, it would look like a flat line.
Triggers: Controlling when plotting starts
The plot window's trigger function works much like a trigger on an oscilloscope. It lets you control when the window starts to record and plot values.
For example, if you are only interested in the trend of the "voltage" curve after the "temperature" value has exceeded a certain limit, then you can specify "temperature" as a trigger.
The plot window will only start plotting after the specified "temperature" threshold has been
exceeded. The temperature "triggers" the plot operation.
Specifying a trigger value
To specify a trigger, use the following ".Trigger"
breakpoint syntax:
{@Plot.MyPlotWindow.Trigger temperature}
The ".Trigger" keyword will instruct the plot window not to draw the value, but
to take it as the trigger value - provided that you have enabled the trigger
function:
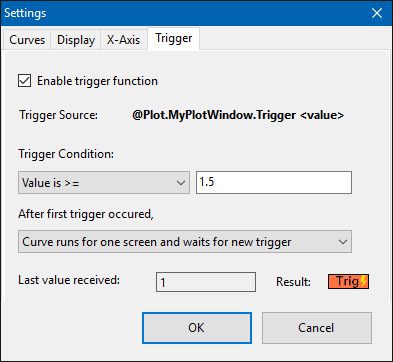
To enable triggering, open the trigger settings window by clicking on the
toolbar icon:
| |
Check this box to enable triggering. If the box is unchecked, the curve plots unconditional |
| |
This shows the syntax for the trigger expression you must use in your breakpoint, also see above |
| |
Here you can specify a trigger condition.
If trigger signals come in, they will be checked against this condition.
Only if the trigger condition is fulfilled will the plot window start.
If you choose "None", then the first trigger value received will trigger, regardless of the value. |
| |
Here you can select, how the plot window reacts after the curve has reached the right edge of the chart.
You can either tell the window to stop and wait in a new trigger value, or to continue drawing. |
| |
This shows the last value of the trigger expression that was received. |
| |
This shows the state of the chart trigger:
 The chart is waiting on the arrival of a trigger signal The chart is waiting on the arrival of a trigger signal
 The chart has received the trigger signal, which met the trigger condition. The chart has received the trigger signal, which met the trigger condition.
The spark symbol lights up at the moment the trigger signal is received.
 The chart has received the trigger signal, which did not meet the trigger condition. The chart has received the trigger signal, which did not meet the trigger condition.
The spark symbol lights up at the moment the trigger signal is received.
The same indicator is located on the right edge of the plot window's toolbar.
|
Freezing a Plot Window
With the freeze icon  on the toolbar,
you can temporarily freeze the window. The data acquisition will continue in the
background. With a second click on the icon, you unfreeze the plot window again.
on the toolbar,
you can temporarily freeze the window. The data acquisition will continue in the
background. With a second click on the icon, you unfreeze the plot window again.
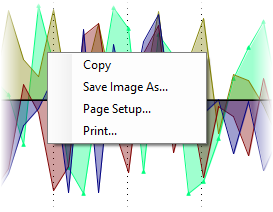
Saving Chart as Images or Printing Charts
If you right click into a chart, a context menu appears that lets you copy the chart to the clipboard as a image, save it as a image or print it: