Showing Text and Watching Expressions When a Breakpoint
is Hit
This version of the documentation page applies to Visual Studio prior to VS2015 and to all versions of Atmel Studio.
Read documentation page for Visual Studio 2015
here.
You can specify, which information from your program (values of variables
etc.) shall be transmitted to Visual Micro when the breakpoint is hit.
This can be a fixed text as well as values of variables or expressions. You can also change
a variable's values on your PC and then can continue
execution with the new variable value.
All this can be achieved with breakpoints that have a "When Hit" action.
After making changes to your breakpoint
as shown here, you
must recompile and upload your sketch in order for the changes to get become effective.
How to Create a Breakpoint With a "When Hit" Action
Read on the general Breakpoints documentation page on how to set breakpoints.
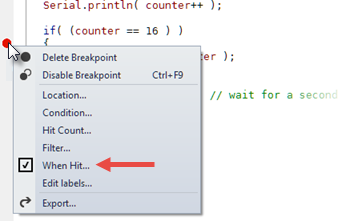
To create a "When Hit" action for your breakpoint, right click the  marker of an existing breakpoint at the left of your code and choose "When Hit...":
The "When Hit" function is a very powerful tool of Visual Micro. It
lets you show the values of variables and lets you change their values while
your sketch is halted in a breakpoint.
After you selected "When Hit..." from the breakpoint context menu,
this window will appear:
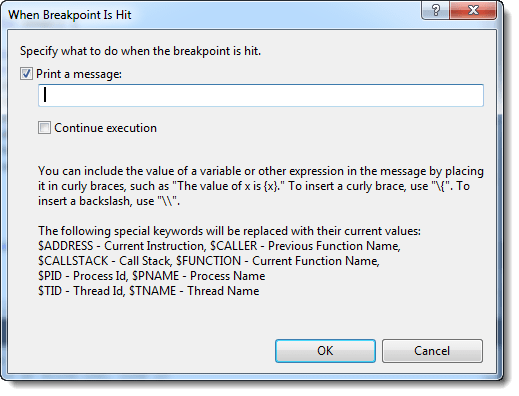
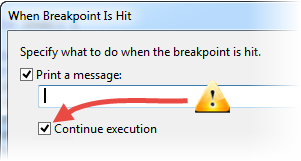
In the text field, you can enter a message that will be shown when the breakpoint
is hit. The message will appear in the
Output Window:
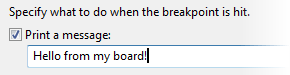
If you put the following in the "When Hit" text field: "Hello
from my board!",...
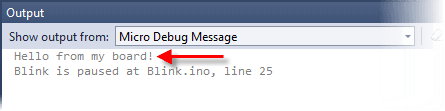
... then the
Output Window will show
the following when the breakpoint is hit:
Please notice, that the "Continue Execution" box is checked by default:
This means that the code does not halt at this point anymore (=breakpoint),
but only show a message in the output window (=tracepoint).
If you want the breakpoint to halt your code as before, make sure that
this box is unchecked.
Showing variable values
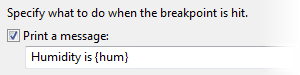
You can not only print static text in your message, but also the current values
of variables.
Put the name of the desired variable in curly braces inside your text, like in
this example:
The Output Window
will show the following when the breakpoint is hit:
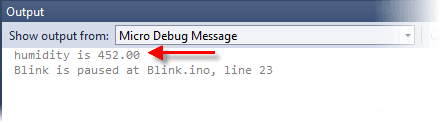
The message shows the actual value of the "hum" variable every time the
breakpoint is hit.
You can mix text and variables as you like, and you can also insert more
two or more variables in the "When Hit" text. See
below for more information about the "When Hit" message string.
If you have an Expression Window open, then the variable value is also reported
there. See below.
More on "When Hit" strings
Showing more than one variable
You can insert two or more variables in the "When Hit" string:
Example:
"Position is {position} and temperature is {currTemp}"
Changing display format
You can specify how your variables are displayed by adding a format specifier
to the message string.
Example:
"Position is {position,HEX}"
will show the variable in hexadecimal.
You can find a complete listing of
available formats in the description of the Serial.print() function
in the
Arduino library reference.
Showing expressions
Instead of variables, you can show expressions, like in this "When Hit" message
string:
Examples:
"Humidity is {humidity*22.1}"
Expressions can also include
function calls:
"Humidity is {getHumidityFromSensor()}"
"Time elapsed is {millis()-startTime} milliseconds"
"Valve {valveNo} is {valvePos == V_SHUT ? "shut" : "open"}"
Tracking and Changing Variable Values Using the Expression Window
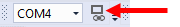
You will notice that there is an "Expression Window" while your debugging
session is running. If this window is missing, make it visible by clicking the
Serial Monitor button in the Visual Micro toolbar:
The Expression Window shows the actual values of all the variables mentioned
in the message strings. Every time a breakpoint is hit, the respective values
will be updated in the Expression Window.
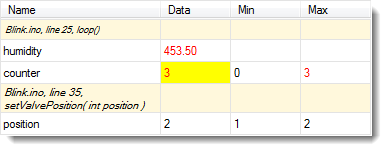
In the above example, we have two breakpoints:
Breakpoint 1 is located in Blink.ino, line 25 and contains this message string:
"Humidity is {humidity}, counter is {counter=?}" (We will take
a closer look at that "=?" after "counter" later). This lets
the values of "humidity" and "counter" appear in the Expression Window.
Breakpoint 2 is located in Blink.ino, line 35 and contains this message string:
"valve position is {position}". This lets the value of
"position" appear in the Expression Window.
Values shown in red have changed since
the last breakpoint hit.
Changing variables
If you put a "=?" behind a variable name, then you will not only see the
value in the Expression Window, but you will also be able to change the variable's
value if your sketch is halted in a breakpoint.
In the above example, the variable "counter" is defined like this: "{counter=?}".
In the Expression Window these variables are shown with a yellow background.
To change the value, click into the yellow cell and enter a new value. If
you press [F5] to continue execution on your board, the
changed variable value (in this case a "counter" value of
3)
will be used.
In order to be able to change a variable, it must
be part of the "When Hit" text of the current breakpoint, even
though the grid cell always appears in yellow.
Showing the function name
You will notice that the "When Hit" window's text mentions "special keywords"
like $FUNCTION or $CALLER. Of these keywords, Visual Micro supports
$FUNCTION. If you use this keyword in your message string, it will be replaced
by the function's name where the breakpoint is placed.
Example:
If you enter this message string: "Hello from the $FUNCTION function",
then you will get this string in the
Output Window:
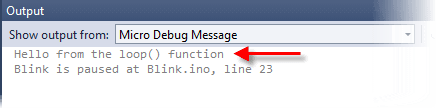
The $FUNCTION placeholder was replaced by the name of the function where
the breakpoint resides. Please note that this placeholder does not
require curly brackets like variable placeholders.
Analog, Digital and Performance Reporting
Visual Micro can report the current status of the analog and digital inputs/outputs
of your board as well as the devices connected to the I2C bus of
your CPU.
If you put the following keywords into the "When Hit" field
of your breakpoint, Visual Micro will open diagram windows when you sketch is
started that show these values in real time.
{@ReportDigital}
Updates the status of the digital I/O lines of your board and opens
the "Report Digitals" diagram window
{@ReportAnalog}
Updates the status of the analog I/O lines of your board and opens
the "Report Analogs" diagram window
{@ReportFreeMemory}
Updates the diagram showing the amount of free memory and opens
the "Report Free Memory" diagram window
{@ReportI2C}
Updates the list of connected I
2C devices and sends a
list of connected I
2C devices to the
Output Window
Changing the Expression Window's Columns
The "Min" and "Max" columns of the expression window show the minimum and maximum
value the variable had over time.
If you right click on the grid header, a context menu appears where you can show/hide
various columns of the table:
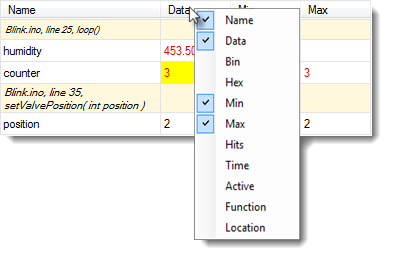
The Time column does not show the
time when the last breakpoint was hit, but the last time the variable's
value has changed.