VS Arduino
Visual Micro >> Hardware Debugging (GDB, GDB WiFi, GDB Stub) >> ESP-WROVER-KIT and Debugging
https://www.visualmicro.com/forums/YaBB.pl?num=1564301523

Message started by ZenForAll on Jul 28th, 2019 at 8:12am

Title: ESP-WROVER-KIT and Debugging
Post by ZenForAll on Jul 28th, 2019 at 8:12am
Hello the ESP-WROVER-KIT supports FTDI Debugging. Is there any support vMicro ??
https://www.visualmicro.com/page/ESP32-Debugging.aspx
I don't see the Menu Debug Hardware. Do I have to install an extra Addon ?

Title: Re: ESP-WROVER-KIT and Debugging
Post by Visual Micro on Jul 28th, 2019 at 9:39am
The image you posted if of the tool bar which you might not have visible. Did you look on the vMicro>Debugger menu?

Always best to post the info requested in the yellow box then we don't have to check your verion numbers etc.?

Which version of Visual Micro are you using? see "extensions and updates>installed>arduino ide for vs"


note: the debug menu has been in visual micro since it's release over the past month. There is an update about to be released with fixes for the WROVER debug. This has nothing to do with your being able to see the debugger.s menus. The update is already available in the releases section of this forum.

Title: Re: ESP-WROVER-KIT and Debugging
Post by ZenForAll on Jul 28th, 2019 at 12:35pm
Oh Sure Sorry
I use to have Ver 1903.16.0 and updated it to
Ver 1907.25.0
I was unable to install Ver. 1907.26.2 for Studio 2019
I got this
[code]Program ESP32_SSID_Table size: 665.898 bytes (used 34% of a 1.966.080 byte maximum) (5,15 secs)
Minimum Memory Usage: 39620 bytes (12% of a 327680 byte maximum)

# Copy build result to 'Project>Property Pages>Intermediate Directory'
# Destination: file:///D:/Visual%20Studio.Arduino/ESP_WROVER_KIT/Extras/ESP32_SSID_Table/Debug/

Uploading 'ESP32_SSID_Table' to 'ESP32 Dev Module' using 'F2232H Dual RS232'
[/code]
https://www.visualmicro.com/forums/YaBB.pl?action=downloadfile;file=vMicroCompiled.txt ( 404 KB | 3 Downloads )

Title: Re: ESP-WROVER-KIT and Debugging
Post by Visual Micro on Jul 28th, 2019 at 1:07pm
Thanks for the note about the vs2019 install. The latest release has been updated.

I see you have enabled the programmer option, you certainly need the latest release for that but you do not need it to test debug. The choice of debugger and choice of programmer are seperate.

It's important also to be clear about the hardware (debugger/programmer) you actually have.

When we have a working config all tools should automatically be available or automatically download.


Title: Re: ESP-WROVER-KIT and Debugging
Post by ZenForAll on Jul 29th, 2019 at 4:43am
If I try to downlad the latest Version
from this site
https://www.visualmicro.com/page/Arduino-Visual-Studio-Downloads.aspx
I get this
rror>
<Code>BlobNotFound</Code>
<Message>
The specified blob does not exist. RequestId:88e131ed-001e-0037-41c7-45653f000000 Time:2019-07-29T04:40:51.0121216Z
</Message>
</Error>

Title: Re: ESP-WROVER-KIT and Debugging
Post by Visual Micro on Jul 29th, 2019 at 9:57am
I forgot to point out that new releases go into this forum before being published to the gallery. https://www.visualmicro.com/forums/YaBB.pl?board=VS_ARDUINO_EXT_RELEASES

Gallery

Yes microsoft have a gallery issue at the moment. When we make the next upload it might fix it. However installing from inside the ide using "extensions and updates" works.

Title: Re: ESP-WROVER-KIT and Debugging
Post by ZenForAll on Jul 29th, 2019 at 12:17pm
Thank you I installed Ver 1907/28/0
Still the same

Info : Configured 2 cores
esp32 interrupt mask on
****[vMicro]**** Uploading App :Error: libusb_open() failed with LIBUSB_ERROR_NOT_SUPPORTED
Info : clock speed 2000 kHz
Error: JTAG scan chain interrogation failed: all ones
Error: Check JTAG interface, timings, target power, etc.
Error: Trying to use configured scan chain anyway...
Error: esp32.cpu0: IR capture error; saw 0x1f not 0x01
Warn : Bypassing JTAG setup events due to errors
Info : Listening on port 3333 for gdb connections
Error: JTAG scan chain interrogation failed: all ones
Error: Check JTAG interface, timings, target power, etc.
Error: Trying to use configured scan chain anyway...
Error: esp32.cpu0: IR capture error; saw 0x1f not 0x01
Warn : Bypassing JTAG setup events due to errors
Error during upload using programmer
The uploader process failed

The uploader process failed
The uploader returned an error
# Copy build result to 'Project>Property Pages>Intermediate Directory'
# Destination: file:///D:/Visual%20Studio.Arduino/ESP_WROVER_KIT/Extras/ESP32_SSID_Table/Debug/

I put Jumpers an TCK TDI TDO TWS
Any other clue !!!

Title: Re: ESP-WROVER-KIT and Debugging
Post by Visual Micro on Jul 29th, 2019 at 1:05pm
There is a new config file missing from the install. The debug team will give you some workaround later today.

Title: Re: ESP-WROVER-KIT and Debugging
Post by ZenForAll on Jul 29th, 2019 at 1:50pm
Sound fair for me Thank you I looking forward

Title: Re: ESP-WROVER-KIT and Debugging
Post by Simon Hopkinson on Jul 29th, 2019 at 2:53pm
Could you try adding a local board.txt to the project and add the below lines (For the Dual RS232H Debugger):


Code (]tools.openocd.debug.openocdscript=esp32-wrover.cfg
tools.f2232h.server.build.openocddebugger=ftdi/esp32_devkitj_v1.cfg[/code):


Then try attaching the debugger again, and it should attach correctly.

Further configuration may be needed to get the upload to work via the programmer (again add into local boards.txt):-

[code]tools.openocd.program.pattern="{program.path}/{program.cmd}" {program.verbose} -s "{program.path}/share/openocd/scripts/" -f "interface/ftdi/esp32_devkitj_v1.cfg" -f "board/{upload.openocdscript}" -c "echo -n {****[vMicro]**** Uploading App :}" -c "telnet_port disabled; program {{runtime.platform.path}/tools/partitions/boot_app0.bin} 0xe000" -c "echo -n {****[vMicro]**** Uploading Bootloader :}" -c "program {{runtime.platform.path}/tools/sdk/bin/bootloader_{build.boot}_{build.flash_freq}.bin} 0x1000"  -c "echo -n {****[vMicro]**** Uploading Sketch :}" -c "program {{build.path}/{build.project_name}.bin} 0x10000"  -c "echo -n {****[vMicro]**** Uploading Partitions :}" -c "program {{build.path}/{build.project_name}.partitions.bin} 0x8000 reset; shutdown"
tools.openocd.upload.pattern="{program.path}/{program.cmd}" {program.verbose} -s "{program.path}/share/openocd/scripts/" -f "interface/ftdi/esp32_devkitj_v1.cfg" -f "board/{upload.openocdscript}" -c "echo -n {****[vMicro]**** Uploading App :}" -c "telnet_port disabled; program {{runtime.platform.path}/tools/partitions/boot_app0.bin} 0xe000" -c "echo -n {****[vMicro]**** Uploading Bootloader :}" -c "program {{runtime.platform.path}/tools/sdk/bin/bootloader_{build.boot}_{build.flash_freq}.bin} 0x1000"  -c "echo -n {****[vMicro]**** Uploading Sketch :}" -c "program {{build.path}/{build.project_name}.bin} 0x10000"  -c "echo -n {****[vMicro]**** Uploading Partitions :}" -c "program {{build.path}/{build.project_name}.partitions.bin} 0x8000 reset; shutdown"

Edit: Update to debug configuration to remove interface select

If you have any issues can you confirm the specific Devkit version you have, just in case there is another element we are missing.

Title: Re: ESP-WROVER-KIT and Debugging
Post by ZenForAll on Jul 29th, 2019 at 7:46pm
First Thank you foe helping second there is no file board.txt
only boards.txt but I thing you mean platform.txt

Title: Re: ESP-WROVER-KIT and Debugging
Post by Visual Micro on Jul 29th, 2019 at 7:57pm
Simon was referring to the "vMicro>Add Code>Board.txt" or you can create one manually. Visual Micro supports a board.txt in the project folder with overrrides.

However since then Visual Micro 1907.29.1 has been published to the new releases section of this forum and includes the missing info. Please install and give it a try.

Thanks

Title: Re: ESP-WROVER-KIT and Debugging
Post by ZenForAll on Jul 29th, 2019 at 8:36pm
###############################################
# DEBUG TOOL
###############################################
# Test VMicro
tools.openocd.debug.openocdscript=esp32-wrover.cfg
tools.f2232h.server.build.openocddebugger=ftdi/esp32_devkitj_v1.cfg
tools.openocd.program.pattern="{program.path}/{program.cmd}" {program.verbose} -s "{program.path}/share/openocd/scripts/" -f "interface/ftd
Code (]i/esp32_devkitj_v1.cfg" -f "board/{upload.openocdscript}" -c "echo -n {****[vMicro):
**** Uploading App :}" -c "telnet_port disabled; program {{runtime.platform.path}/tools/partitions/boot_app0.bin} 0xe000" -c "echo -n {****[vMicro]**** Uploading Bootloader :}" -c "program {{runtime.platform.path}/tools/sdk/bin/bootloader_{build.boot}_{build.flash_freq}.bin} 0x1000"  -c "echo -n {****[vMicro]**** Uploading Sketch :}" -c "program {{build.path}/{build.project_name}.bin} 0x10000"  -c "echo -n {****[vMicro]**** Uploading Partitions :}" -c "program {{build.path}/{build.project_name}.partitions.bin} 0x8000 reset; shutdown"
tools.openocd.upload.pattern="{program.path}/{program.cmd}" {program.verbose} -s "{program.path}/share/openocd/scripts/" -f "interface/ftdi/esp32_devkitj_v1.cfg" -f "board/{upload.openocdscript}" -c "echo -n {****[vMicro]**** Uploading App :}" -c "telnet_port disabled; program {{runtime.platform.path}/tools/partitions/boot_app0.bin} 0xe000" -c "echo -n {****[vMicro]**** Uploading Bootloader :}" -c "program {{runtime.platform.path}/tools/sdk/bin/bootloader_{build.boot}_{build.flash_freq}.bin} 0x1000"  -c "echo -n {****[vMicro]**** Uploading Sketch :}" -c "program {{build.path}/{build.project_name}.bin} 0x10000"  -c "echo -n {****[vMicro]**** Uploading Partitions :}" -c "program {{build.path}/{build.project_name}.partitions.bin} 0x8000 reset; shutdown"


##### GDB with Interface Specified for custom external debuggers
tools.openocd.debug.path={runtime.tools.openocd-espressif-esp32-10.0.1.path}
tools.openocd.debug.cmd=bin/openocd
tools.openocd.debug.cmd.windows=bin/openocd.exe
tools.openocd.debug.params.verbose=-d2
tools.openocd.debug.openocdscript=esp-wroom-32.cfg
tools.openocd.debug.args={params.verbose} -l "{{build.path}/{build.project_name}_DebugOpenOCD.log}" -s "{path}/share/openocd/scripts/" -f "{path}/share/openocd/scripts/interface/{build.openocddebugger}" -c "set ESP32_RTOS none" -f "{path}/share/openocd/scripts/board/{openocdscript}" -c "init"
tools.openocd.debug.address=localhost:3333

# debug.tool=f2232mm


# ESP32 PROG (Identical to  F2232H Dual RS232)
###tools.esp32prog.server.build.openocddebugger=ftdi/minimodule-lowcost.cfg
tools.esp32prog.args=-ex "set remote hardware-watchpoint-limit 2" -ex "mon reset halt" -ex "flushregs" -ex "thb app_main" -ex "c"
tools.esp32prog.path={runtime.tools.xtensa-esp32-elf-gcc.path}/bin
tools.esp32prog.cmd=xtensa-esp32-elf-gdb.exe
tools.esp32prog.pattern="{path}/{cmd}" {args}
tools.esp32prog.server.tool=openocd

# F2232H Dual RS232
### tools.f2232h.server.build.openocddebugger=ftdi/minimodule-lowcost.cfg
tools.f2232h.args=-ex "set remote hardware-watchpoint-limit 2" -ex "mon reset halt" -ex "flushregs" -ex "thb app_main" -ex "c"
tools.f2232h.path={runtime.tools.xtensa-esp32-elf-gcc.path}/bin
tools.f2232h.cmd=xtensa-esp32-elf-gdb.exe
tools.f2232h.pattern="{path}/{cmd}" {args}
tools.f2232h.server.tool=openocd

I tried this in platform.txt but I still get

but Studio is still asking for "interface/ftdi/minimodule-lowcost.cfg"
I remarked all Textfiles where does Studio gets this message. Could you be a little bit more specific please.

Title: Re: ESP-WROVER-KIT and Debugging
Post by Visual Micro on Jul 29th, 2019 at 8:46pm
Please undo whatever you have changed and install the latest release which has been published to the gallery.


Title: Re: ESP-WROVER-KIT and Debugging
Post by ZenForAll on Jul 30th, 2019 at 7:10am
I installed
Visual.Micro.Arduino.Studio_1907_29_3
same. I can't find the file board.txt. In what folder should it be.

Title: Re: ESP-WROVER-KIT and Debugging
Post by Simon Hopkinson on Jul 30th, 2019 at 8:14am
Once you have the new one installed, you wont need the boards.txt or the lines of config supplied before as they are now built in.

Simply select the ESP32Wrover board, and the ESP32 DEVKIT Debugger / Programmer and attach / upload as before.

Title: Re: ESP-WROVER-KIT and Debugging
Post by ZenForAll on Jul 30th, 2019 at 11:29am

Code (css):

Uploading 'ESP32_SSID_Table' to 'ESP32 Wrover Module' using 'ESP32 DEVKIT'
Uploader started for board ESP32 Wrover Module
Uploader will use programmer name: esp32devkit
C:\ProgramData\vmicro\tools\openocd-espressif-esp32-10.0.1\bin\openocd.exe -d2 -s "C:\ProgramData\vmicro\tools\openocd-espressif-esp32-10.0.1/share/openocd/scripts/" -f "interface/ftdi/esp32_devkitj_v1.cfg.cfg" -f "board/esp-wroom-32.cfg" -c "echo -n {****[vMicro]**** Uploading App :}" -c "telnet_port disabled; program {D:\Arduino.IDE\hardware\espressif\esp32/tools/partitions/boot_app0.bin} 0xe000" -c "echo -n {****[vMicro]**** Uploading Bootloader :}" -c "program {D:\Arduino.IDE\hardware\espressif\esp32/tools/sdk/bin/bootloader_qio_80m.bin} 0x1000" -c "echo -n {****[vMicro]**** Uploading Sketch :}" -c "program {C:\Users\ats37\AppData\Local\Temp\VMBuilds\ESP32_SSID_Table\espressif_esp32wrover\Debug/ESP32_SSID_Table.ino.bin} 0x10000" -c "echo -n {****[vMicro]**** Uploading Partitions :}" -c "program {C:\Users\ats37\AppData\Local\Temp\VMBuilds\ESP32_SSID_Table\espressif_esp32wrover\Debug/ESP32_SSID_Table.ino.partitions.bin} 0x8000 reset; shutdown"
Open On-Chip Debugger  v0.10.0-esp32-20190313 (2019-03-13-09:57)
Error during upload using programmer
The uploader process failed

The uploader process failed
Licensed under GNU GPL v2
For bug reports, read
     http://openocd.org/doc/doxygen/bugs.html
debug_level: 2
embedded:startup.tcl:63: Error: Can't find interface/ftdi/esp32_devkitj_v1.cfg.cfg
in procedure 'script'
at file "embedded:startup.tcl", line 63
The uploader returned an error
# Copy build result to 'Project>Property Pages>Intermediate Directory'
# Destination: file:///D:/Visual%20Studio.Arduino/ESP_WROVER_KIT/Extras/ESP32_SSID_Table/Debug/


We are coming closer  :D :D
dubble Extension ????
esp32_devkitj_v1.cfg.cfg

Title: Re: ESP-WROVER-KIT and Debugging
Post by ZenForAll on Jul 30th, 2019 at 12:01pm
I changes in programmers.txt the line
esp32devkit.openocddebugger=ftdi/esp32_devkitj_v1.cfg.cfg to
esp32devkit.openocddebugger=ftdi/esp32_devkitj_v1.cfg
and then I get this again


Code (css):

Uploading 'ESP32_SSID_Table' to 'ESP32 Wrover Module' using 'ESP32 DEVKIT'
Uploader started for board ESP32 Wrover Module
Uploader will use programmer name: esp32devkit
C:\ProgramData\vmicro\tools\openocd-espressif-esp32-10.0.1\bin\openocd.exe -d2 -s "C:\ProgramData\vmicro\tools\openocd-espressif-esp32-10.0.1/share/openocd/scripts/" -f "interface/ftdi/esp32_devkitj_v1.cfg" -f "board/esp-wroom-32.cfg" -c "echo -n {****[vMicro]**** Uploading App :}" -c "telnet_port disabled; program {D:\Arduino.IDE\hardware\espressif\esp32/tools/partitions/boot_app0.bin} 0xe000" -c "echo -n {****[vMicro]**** Uploading Bootloader :}" -c "program {D:\Arduino.IDE\hardware\espressif\esp32/tools/sdk/bin/bootloader_qio_80m.bin} 0x1000" -c "echo -n {****[vMicro]**** Uploading Sketch :}" -c "program {C:\Users\ats37\AppData\Local\Temp\VMBuilds\ESP32_SSID_Table\espressif_esp32wrover\Debug/ESP32_SSID_Table.ino.bin} 0x10000" -c "echo -n {****[vMicro]**** Uploading Partitions :}" -c "program {C:\Users\ats37\AppData\Local\Temp\VMBuilds\ESP32_SSID_Table\espressif_esp32wrover\Debug/ESP32_SSID_Table.ino.partitions.bin} 0x8000 reset; shutdown"
Open On-Chip Debugger  v0.10.0-esp32-20190313 (2019-03-13-09:57)
Licensed under GNU GPL v2
For bug reports, read
     http://openocd.org/doc/doxygen/bugs.html
debug_level: 2
none separate
adapter speed: 2000 kHz
Info : Configured 2 cores
esp32 interrupt mask on
****[vMicro]**** Uploading App :Error: libusb_open() failed with LIBUSB_ERROR_NOT_SUPPORTED
Info : clock speed 2000 kHz
Error: JTAG scan chain interrogation failed: all ones
Error: Check JTAG interface, timings, target power, etc.
Error: Trying to use configured scan chain anyway...
Error: esp32.cpu0: IR capture error; saw 0x1f not 0x01
Warn : Bypassing JTAG setup events due to errors
Info : Listening on port 3333 for gdb connections
Error: JTAG scan chain interrogation failed: all ones
Error: Check JTAG interface, timings, target power, etc.
Error: Trying to use configured scan chain anyway...
Error: esp32.cpu0: IR capture error; saw 0x1f not 0x01
Warn : Bypassing JTAG setup events due to errors
Error during upload using programmer
The uploader process failed

The uploader process failed
The uploader returned an error
# Copy build result to 'Project>Property Pages>Intermediate Directory'
# Destination: file:///D:/Visual%20Studio.Arduino/ESP_WROVER_KIT/Extras/ESP32_SSID_Table/Debug/


:'( :'( :'( :'( :'(

Title: Re: ESP-WROVER-KIT and Debugging
Post by Simon Hopkinson on Jul 30th, 2019 at 1:26pm
This is still failing to connect to the ESP Chip via the debugger, but as it is built into the board its unlikely the connections between the ESP and the debugger.

Can you confirm you arent using the MicroSD Functionality, and you don't have anything attached to the below pins:
EN
GPIO15
GPIO12
GPIO13
GPIO14

Can you also confirm which version of the Wrover-Devkit board you have (is it the 4.1 board as detailed below?)

https://docs.espressif.com/projects/esp-idf/en/latest/hw-reference/get-started-wrover-kit.html

Title: Re: ESP-WROVER-KIT and Debugging
Post by ZenForAll on Jul 30th, 2019 at 2:48pm
Hallo
that is what I use
https://docs.espressif.com/projects/esp-idf/en/latest/hw-reference/get-started-wrover-kit.html

JTAG / JP2
.      ESP32 Pin      JTAG Signal
1      EN      TRST_N
2      MTMS / GPIO14      TMS
3      MTDO / GPIO15      TDO
4      MTDI / GPIO12      TDI
5      MTCK / GPIO13      TCK

A plain board.

Title: Re: ESP-WROVER-KIT and Debugging
Post by ZenForAll on Jul 30th, 2019 at 3:01pm
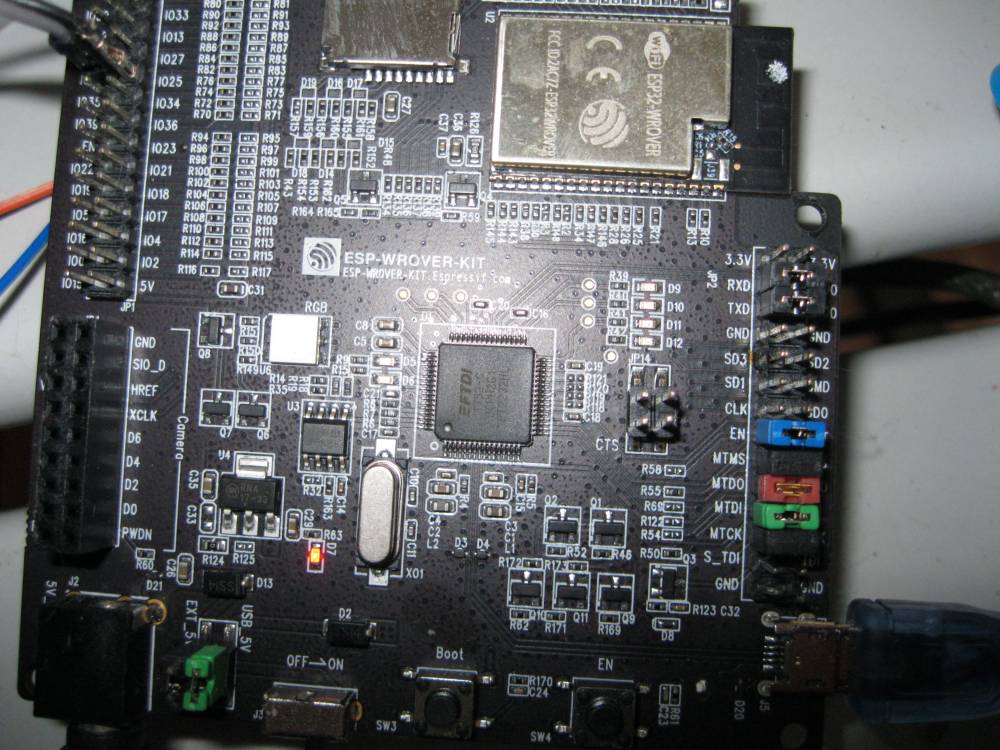
Check out the picture so you can see the jumpers on the board
wover-kit.jpg ( 142 KB | 1 Download )

Title: Re: ESP-WROVER-KIT and Debugging
Post by Simon Hopkinson on Jul 31st, 2019 at 9:24am
Thanks for the image, and the only difference to the Espressif Setup docs I can see is the EN jumper being connected, though believe this is OK as still part of the JTAG link to the debugger (so expect it makes no difference)

When I have our Wrover module out of another project Ill double check all of this through and update with any other information.

Title: Re: ESP-WROVER-KIT and Debugging
Post by ZenForAll on Aug 1st, 2019 at 6:40am
Oh thank you I tried it with and without the EN Jumper
When do you think we can Progress
Have a wonderful sunny Sommerday 8-)

Title: Re: ESP-WROVER-KIT and Debugging
Post by Simon Hopkinson on Aug 1st, 2019 at 1:05pm
There are some minor amendments to the board config to make within vMicro, however it should have worked more than it has at present.

If you just run the command line below, it should show JTAG setting up OK:
e.g "Info : JTAG tap: esp32.cpu0 tap/device found:"

[code]"C:\ProgramData\vmicro\tools\openocd-espressif-esp32-10.0.1\bin/openocd.exe" -d2 -s "C:\ProgramData\vmicro\tools\openocd-espressif-esp32-10.0.1/share/openocd/scripts/" -f "C:\ProgramData\vmicro\tools\openocd-espressif-esp32-10.0.1/share/openocd/scripts/interface/ftdi/esp32_devkitj_v1.cfg" -c "set ESP32_RTOS none" -f "C:\ProgramData\vmicro\tools\openocd-espressif-esp32-10.0.1/share/openocd/scripts/board/esp32-wrover.cfg" -c "init"[/code]

If this shows (as before) "JTAG scan chain failed", can you confirm you can upload using normal Serial?  And that all Jumpers are in place fully?

I get the JTAG error when I have missed a jumper off the board...

This software is common to both the debug and upload with programmer, and if this doesn't work it is outside vMicro, as the above is what Espressif detail on their pages:

https://docs.espressif.com/projects/esp-idf/en/latest/api-guides/jtag-debugging/index.html#run-openocd

Title: Re: ESP-WROVER-KIT and Debugging
Post by ZenForAll on Aug 2nd, 2019 at 3:08pm
Thank you Simon, I get this but only if I to this the first time and without External Power
I'm on the move to Majorca, so all my other stuff is already in Boxes, I will figure where I have my other 2 ESP-WROVER-KIT boars and will tell you what Results I get, Have a wonderful Sommer WEEKend
Tinkerer Martin Michael

[code]
C:\WINDOWS\system32>
C:\WINDOWS\system32>"C:\ProgramData\vmicro\tools\openocd-espressif-esp32-10.0.1\bin/openocd.exe" -d2 -s "C:\ProgramData\vmicro\tools\openocd-espressif-esp32-10.0.1/share/openocd/scripts/" -f "C:\ProgramData\vmicro\tools\openocd-espressif-esp32-10.0.1/share/openocd/scripts/interface/ftdi/esp32_devkitj_v1.cfg" -c "set ESP32_RTOS none" -f "C:\ProgramData\vmicro\tools\openocd-espressif-esp32-10.0.1/share/openocd/scripts/board/esp32-wrover.cfg" -c "init"
Open On-Chip Debugger  v0.10.0-esp32-20190313 (2019-03-13-09:57)
Licensed under GNU GPL v2
For bug reports, read
        http://openocd.org/doc/doxygen/bugs.html
debug_level: 2
none separate
none
adapter speed: 20000 kHz
Info : Configured 2 cores
esp32 interrupt mask on
Info : ftdi: if you experience problems at higher adapter clocks, try the command "ftdi_tdo_sample_edge falling"
Info : clock speed 20000 kHz
Info : JTAG tap: esp32.cpu0 tap/device found: 0x120034e5 (mfg: 0x272 (Tensilica), part: 0x2003, ver: 0x1)
Info : JTAG tap: esp32.cpu1 tap/device found: 0x120034e5 (mfg: 0x272 (Tensilica), part: 0x2003, ver: 0x1)
Info : esp32: Debug controller 0 was reset (pwrstat=0x5F, after clear 0x0F).
Info : esp32: Core 0 was reset (pwrstat=0x5F, after clear 0x0F).
Info : Listening on port 3333 for gdb connections
Info : Listening on port 6666 for tcl connections
Info : Listening on port 4444 for telnet connections
Info : esp32: Debug controller 1 was reset (pwrstat=0x5F, after clear 0x0F).
Info : esp32: Core 1 was reset (pwrstat=0x5F, after clear 0x0F).
Info : Detected debug stubs @ 3ffc241c on core0 of target 'esp32'
Info : xtensa_poll: Target offline
Error: xtensa_poll: Target failure
Polling target esp32 failed, trying to reexamine
Examination failed, GDB will be halted. Polling again in 100ms
Error: xtensa_poll: Target failure
Polling target esp32 failed, trying to reexamine
Examination failed, GDB will be halted. Polling again in 300ms
Error: xtensa_poll: Target failure
Polling target esp32 failed, trying to reexamine
Examination failed, GDB will be halted. Polling again in 700ms
Error: xtensa_poll: Target failure
Polling target esp32 failed, trying to reexamine
Examination failed, GDB will be halted. Polling again in 1500ms
Error: xtensa_poll: Target failure
Polling target esp32 failed, trying to reexamine
Examination failed, GDB will be halted. Polling again in 3100ms
Error: xtensa_poll: Target failure
Polling target esp32 failed, trying to reexamine
Examination failed, GDB will be halted. Polling again in 6300ms
Error: xtensa_poll: Target failure
Polling target esp32 failed, trying to reexamine
Examination failed, GDB will be halted. Polling again in 6300ms
shutdown command invoked
Info : Restore debug stubs @ 3ffc241c on core0 of target 'esp32'
Warn : Flash driver of esp32.flash does not support free_driver_priv()
Warn : Flash driver of irom does not support free_driver_priv()
Warn : Flash driver of drom does not support free_driver_priv()


[/code]

Title: Re: ESP-WROVER-KIT and Debugging
Post by Visual Micro on Aug 3rd, 2019 at 9:49am
I think that's what Simon was hoping to see. He posted an update last week for the wrover but it was no use until we got the power issue resolve.

Please update to the "work in progress" release from the releases section of this forum, see link below (1907.31+). It's not in the gallery yet.

https://www.visualmicro.com/forums/YaBB.pl?board=VS_ARDUINO_EXT_RELEASES

Title: Re: ESP-WROVER-KIT and Debugging
Post by ZenForAll on Aug 20th, 2019 at 11:54am
I have Version 4.1 And what should I do wrong I just can put the Jumper  on the right spot.
Wait I'm moving 11.9 to Majorca and then I have 2 new Wrover Board available. The we can go on. THX for helping me

Title: Re: ESP-WROVER-KIT and Debugging
Post by ZenForAll on Aug 20th, 2019 at 11:54am
I have Version 4.1 And what should I do wrong I just can put the Jumper  on the right spot.
Wait I'm moving 11.9 to Majorca and then I have 2 new Wrover Board available. The we can go on. THX for helping me

Title: Re: ESP-WROVER-KIT and Debugging
Post by ZenForAll on Dec 10th, 2019 at 4:45pm
Hello I moved to Manorca and tried today my ESP-Wrover Kit and debugging works. I don't know how to use ist but at least it works. Thx
I installed yesterday the latest new Addon and Visual Studio  as well

Title: Re: ESP-WROVER-KIT and Debugging
Post by Simon Hopkinson on Dec 10th, 2019 at 5:02pm
Thanks for the update, and glad to hear it is all working now.

Some additional links will appear when selecting the debugger, and the best place to begin is the Arduino GDB in Brief page:
https://www.visualmicro.com/page/User-Guide.aspx?doc=Arduino-gdb-In-Brief.html

VS Arduino » Powered by YaBB 2.6.12!
YaBB Forum Software © 2000-2024. All Rights Reserved.