Edit:
I think it has a few options you might call profiling but i might be being too simplistic. I hadn't thought of calling it profiling but I think you might be right. See what you think.
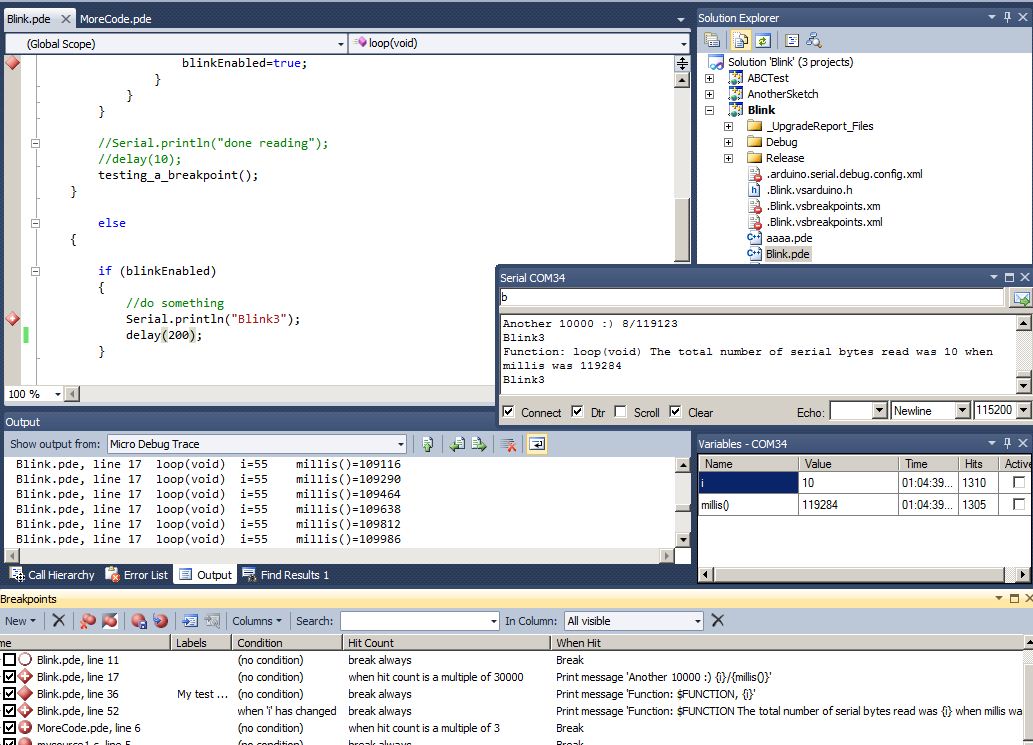
Features such as new vs output window type containing a running trace of each active breakpoint. example: "time : function/breakpoint details + num hits" and a variables window shows num hits and last update date/time.
You can also generate your own text/display messages using the breakpoint screen in vs. The messages can be combined in the serial viewer or there is an option to show in seperate text message output window with time and other variables of choice merged into the message
You will also see on the vs breakpoint config screens the ability to call a macro instead of a text message. I am looking forward to supporting macros. Used properly they have� huge potential!
So, .net macros will be called simply by setting a breakpoint. Visual Studio breakpoints can be assigned conditional statements. The debug upgrade allows us to enter normal arduino code as the conditions. vm automatically adds the conditions code along with "if () {}" etc during the "debug" compile.
This means that .net macros can be executed in response to values falling "in or out" of a given range or for any other normal arduino code condition
To future versions I hope to add the ability to show a selectection of the "tracked" breakpoint variables in a graph control and to add a few other tool windows showing various running summary data
I am looking forward to hooking up my xbees for a remote debug session
Any ideas and suggestions will be welcomed. It's prob easier to see than to visualize


 Pages: 1
 Profiler (Read 5553 times)