Since version 2023.1103.00, Visual Micro supports debugging using the same tools and configuration as the Arduino IDE, and these are automatically detected from the board package you have installed, the same as in the Arduino IDE.
The published list of Arduino IDE compatible boards for debugging can be found here.
To use this simply select the vMicro > Debugger > Debug: Arduino option
There may be additional options you may have on your board options menu (see below), which will change the debug probe selected in this scenario.
Additional Drivers may still be required to allow debugging to work, which can be
installed using Zadig where necessary.
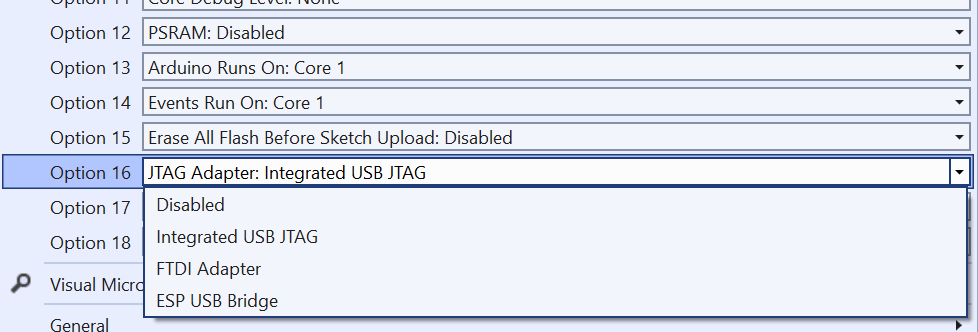
Board Options Selection
Some boards (e.g. ESP32S3) will show addition selections on the Board Options menu if they support more than one debug probe in the Arduino IDE:
Start Debugging
- If you know where you want the first breakpoint in your code, add it now
- To start the debugging process, you can either:
- "Debug > Attach to Process" button if your code has already been uploaded to the target board
- "Debug > Start Debugging" if your code has not been uploaded
Specific Troubleshooting
Additional messages may be shown in the Output Window when attempting to start a debug session:
ERROR: No debug.toolchain can be found in the Arduino 2 Configuration
This means that the Arduino IDE configurations required have not been implemented for your board.
ERROR: No debug.tool can be found in the Arduino 2 Configuration
This means that the executable referenced for debugging can not be found, and is most likely an issue with the Board Package version installed.
Log this on our forum with the logging information requested at the top of the forum and we will be able to show what information is needed to report this to the board package author.