This troubleshooter is for the Hardware Debugger Option in Visual Micro, and can be used to troubleshoot using the Hardware Programmer options in a similar way.
Click on the buttons after each question to work through the possible solutions, the page will advance to the next question/solution as needed.... (just press refresh to start again)
Step 2
Step 2
Are you sure all connections made are correctly? (hints and tips appear in the output window as shown below
And do both devices show their power LEDs normally when connected to the each other and your PC?
Yes No / Unsure
(Tip: We have more information in our connection diagrams from the links on our debugger list here, just click the green check mark for the debugger and device you are using)

Step 4
Step 4
Enable the "vMicro > Upload > Verbose" option, to expose further logging, then try running the "Debug > Attach" command again.
Review the "Output Window > Debug" output.
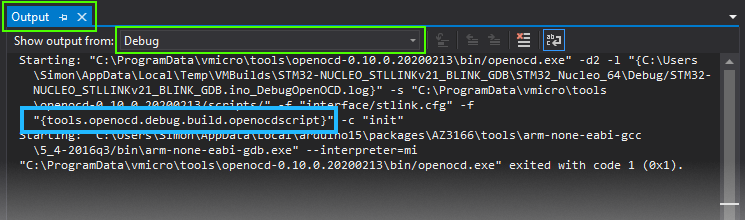
Are there any unresolved properties visible in this window? (e.g. {build.openocdscript}) (shown in the light blue box above)
Looks OK Its Missing something
Never Lands on Breakpoint
Reset Target Board
If the debugger starts and connects, but you never land on your breakpoint..... stop the session, and reboot the target board using its reset button.
Try connecting the debugging session again, it should now work as expected...
That Didn't Work....
Connection Help
Connection Help
Further information and links to Wiring Diagrams is shown in the Output Window when a Debugger is selected. Its always worth checking the connections, and polarity of ribbon cables / connectors, as this will prevent any debugging working.
Tips:-
Cable Lengths: Try and keep cable lengths to a minimum, and use cables with solid connections
Power Note:You may still need to supply additional power to your target (via USB lead or power pins direct).
One sign things are wrong is when they both work until they are connected together, then you have a short somewhere in the connections (check VCC/GND specifically, or polarity of ribbon if using a ribbon cable)
Ribbon Cables:
When working with Ribbon cables make sure you pay attention to the polaity marking on one side, as these ribbons appear reversibl at a glance, but are not.
Example 20 Pin JTAG Ribbon cable with (D)ebugger and (T)arget marked
ebugger and (T)arget marked")
When working with board connections, they do not always have a housing for the tooth and notch to meet in, so check for a dot, or other markings as to which way around they should be.
Example 10 Pin SWD Ribbon cable with (D)ebugger and (T)arget marked
ebugger and (T)arget marked")
We have more information in our connection diagrams from the links on our debugger list here, just click the green check mark for the debugger and device you are using.
Cannot Find Log File
Cannot Find Log File
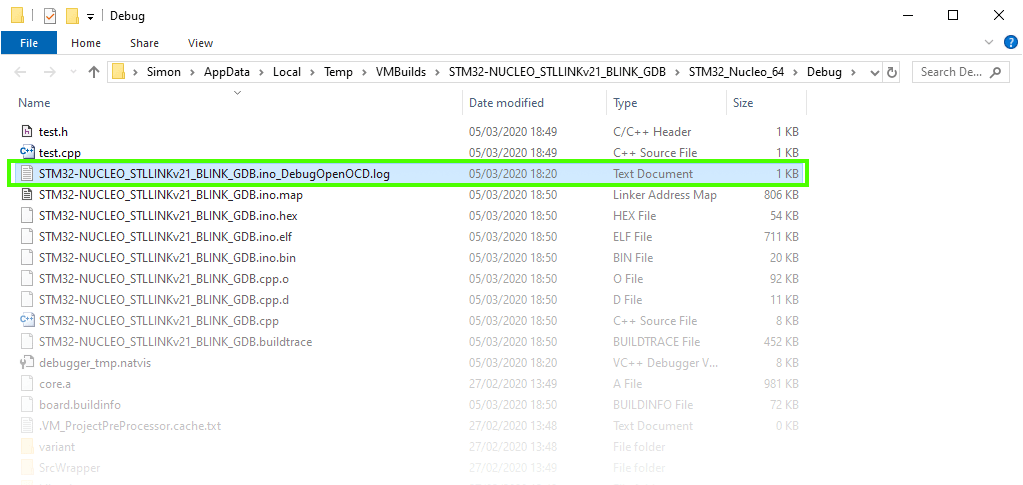
(If you cannot find the Build Folder, run a build, and inspect the "Output > Micro Build" Window. Find the "Build Folder" as shown below:
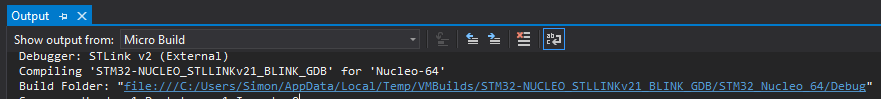
Hold CTRL + Left Click on the link to open it in Windows Explorer, you should see the log file as shown below:
Found It, Take Me Back... Still can"t find it
Check Driver Installations
Check Driver Installations
Check the Output window when selecting the debugger, you may need to amend the Driver for some Debuggers (JLink, FT2232H, FT2232M etc..). Check our Documentation for more information.
This can be done using the Zadig Tool, and for Visual Micro we want to install the WinUSB Driver
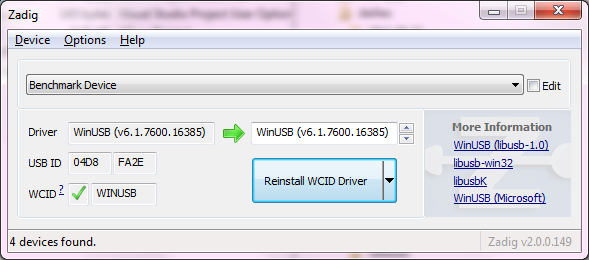
If you do not need a driver, and the VID PID it is searching for does not appear to match your product, press the Help button below
Help
Conflicting USB Session
Conflicting USB Session
This ACCESS_ERROR means that there is already a connection to the debugger elsewhere on your machine.
Hanging on Debug Attach
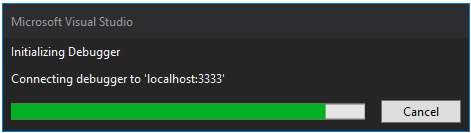
Hanging on Debug Attach
If VS appears to hang at this point (a progress action like below that never finishes), try disconnecting the debugger and board from the PC, and restarting VS. Then reconnect the Debugger, then the board to the PC.
GDB Command Line
GDB Command Line
If you are using the Black Magic Probe, or a GDBStub implementation (e.g. Uno/ESP8266), things differ slightly, follow the instructions below:- (This also applies if you wish to run all commands manually (to get a new configuration working)
- Unplug the Debugger from your PC to ensure the process exposes the command lines
- Try attaching the Debugger in Visual Micro again, the command line will be revealed in the "Output Window > Show Output From > Micro Build"
- Re-Attach the Debugger to your PC so we can connect again
- Take the MIDebuggerPath, and MIDebuggerArgs lines and copy them into Notepad
"MIDebuggerPath": "C:\\Users\\Simon\\AppData\\Local\\arduino15\\packages\\arduino\\tools\\arm-none-eabi-gcc\\7-2017q4/bin/arm-none-eabi-gdb.exe", "MIDebuggerArgs": "-nh -b 115200 -ex \"target extended-remote \\\\.\\COM62\" -ex \"monitor swdp_scan\" -ex \"attach 1\"",
- Now Remove the "MiDebuggerPath": and "MiDebuggerArgs": from the text, and the trailing comma on each line, and the outer most double quotes on each line:
C:\\Users\\Simon\\AppData\\Local\\arduino15\\packages\\arduino\\tools\\arm-none-eabi-gcc\\7-2017q4/bin/arm-none-eabi-gdb.exe -nh -b 115200 -ex \"target extended-remote \\\\.\\COM62\" -ex \"monitor swdp_scan\" -ex \"attach 1\"
- Now put it on a single line, and Replace \" with ", then \\ with \:
C:\Users\Simon\AppData\Local\arduino15\packages\arduino\tools\arm-none-eabi-gcc\7-2017q4/bin/arm-none-eabi-gdb.exe -nh -b 115200 -ex "target extended-remote \\.\COM62" -ex "monitor swdp_scan" -ex "attach 1"
- Now paste this final command into a command prompt window, and press Enter - this should reveal more information about the problem

If this appears to be running as expected, you can press CTRL+C to break immediately, and type 'c' + ENTER to continue execution.
Does everything seem to work with the Command Line? (just not in Visual Studio)
VS to GDB Logging
VS to GDB Logging
So now we know it works manually, and not in VS, we need to capture some additional logging detail to help us diagnose further.
To Enable this additional Logging:-
- Close all Command windows from previous steps
- Go to your Visual Studio solution with the issue.
- Open the VS Command Window (View > Other Windows > Command Window)
- Type in the Command Debug.MIDebugLog /On /OutputWindow, and press Enter
- Try and Attach the Debugger (or which ever action is causing issues)
- You will have additional detail in the Output > Debug window
- If you cannot see any clear problems, save this output to a file to log on the Forum.

If this hasn"t helped to identify your issue, click the button below...
Help
Get Additional Help
Get Additional Help
Please create a new log on the Forum GDB Board, and attach the output from the "Output > Debug" window which led you here.
Please also enable the vMicro > Compile > Show Build Properties & Verbose options and perform a build.
Both logs should be attached to the forum post in a ZIP, so we can help you as quickly as possible...
(a screenshot of your specific error, or place where it hangs may also be useful in some scenarios)